Laotian vs Immigrants from Latvia Ambulatory Disability
COMPARE
Laotian
Immigrants from Latvia
Ambulatory Disability
Ambulatory Disability Comparison
Laotians
Immigrants from Latvia
5.7%
AMBULATORY DISABILITY
99.7/ 100
METRIC RATING
64th/ 347
METRIC RANK
6.0%
AMBULATORY DISABILITY
71.1/ 100
METRIC RATING
159th/ 347
METRIC RANK
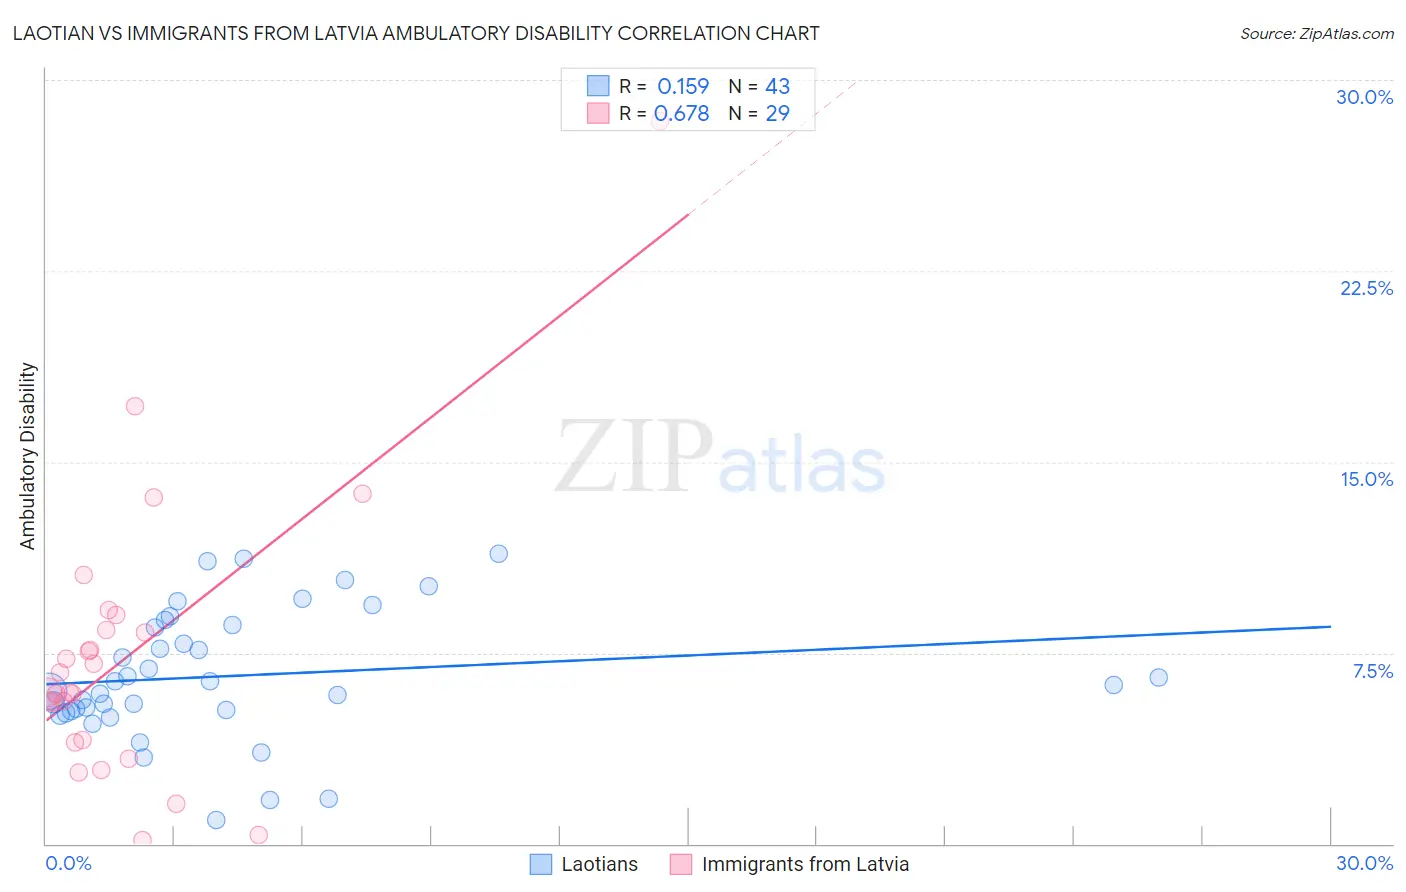
Laotian vs Immigrants from Latvia Ambulatory Disability Correlation Chart
The statistical analysis conducted on geographies consisting of 224,814,363 people shows a poor positive correlation between the proportion of Laotians and percentage of population with ambulatory disability in the United States with a correlation coefficient (R) of 0.159 and weighted average of 5.7%. Similarly, the statistical analysis conducted on geographies consisting of 113,736,193 people shows a significant positive correlation between the proportion of Immigrants from Latvia and percentage of population with ambulatory disability in the United States with a correlation coefficient (R) of 0.678 and weighted average of 6.0%, a difference of 6.9%.
Ambulatory Disability Correlation Summary
| Measurement | Laotian | Immigrants from Latvia |
| Minimum | 0.92% | 0.16% |
| Maximum | 11.4% | 28.4% |
| Range | 10.4% | 28.2% |
| Mean | 6.6% | 7.4% |
| Median | 6.2% | 6.0% |
| Interquartile 25% (IQ1) | 5.2% | 4.0% |
| Interquartile 75% (IQ3) | 8.6% | 8.7% |
| Interquartile Range (IQR) | 3.4% | 4.7% |
| Standard Deviation (Sample) | 2.5% | 5.6% |
| Standard Deviation (Population) | 2.5% | 5.5% |
Similar Demographics by Ambulatory Disability
Demographics Similar to Laotians by Ambulatory Disability
In terms of ambulatory disability, the demographic groups most similar to Laotians are Immigrants from Switzerland (5.7%, a difference of 0.030%), Israeli (5.7%, a difference of 0.12%), Immigrants from France (5.6%, a difference of 0.13%), Immigrants from Uganda (5.7%, a difference of 0.13%), and Sri Lankan (5.7%, a difference of 0.16%).
| Demographics | Rating | Rank | Ambulatory Disability |
| Immigrants | Brazil | 99.8 /100 | #57 | Exceptional 5.6% |
| Immigrants | Zimbabwe | 99.8 /100 | #58 | Exceptional 5.6% |
| Immigrants | Afghanistan | 99.8 /100 | #59 | Exceptional 5.6% |
| Immigrants | Lithuania | 99.8 /100 | #60 | Exceptional 5.6% |
| Immigrants | Belgium | 99.7 /100 | #61 | Exceptional 5.6% |
| Immigrants | Spain | 99.7 /100 | #62 | Exceptional 5.6% |
| Immigrants | France | 99.7 /100 | #63 | Exceptional 5.6% |
| Laotians | 99.7 /100 | #64 | Exceptional 5.7% |
| Immigrants | Switzerland | 99.7 /100 | #65 | Exceptional 5.7% |
| Israelis | 99.6 /100 | #66 | Exceptional 5.7% |
| Immigrants | Uganda | 99.6 /100 | #67 | Exceptional 5.7% |
| Sri Lankans | 99.6 /100 | #68 | Exceptional 5.7% |
| Peruvians | 99.5 /100 | #69 | Exceptional 5.7% |
| Sierra Leoneans | 99.4 /100 | #70 | Exceptional 5.7% |
| Immigrants | Peru | 99.4 /100 | #71 | Exceptional 5.7% |
Demographics Similar to Immigrants from Latvia by Ambulatory Disability
In terms of ambulatory disability, the demographic groups most similar to Immigrants from Latvia are Immigrants from Fiji (6.0%, a difference of 0.010%), Ghanaian (6.0%, a difference of 0.020%), Northern European (6.0%, a difference of 0.050%), Immigrants from Scotland (6.0%, a difference of 0.070%), and Central American (6.0%, a difference of 0.080%).
| Demographics | Rating | Rank | Ambulatory Disability |
| Immigrants | Austria | 78.8 /100 | #152 | Good 6.0% |
| Syrians | 75.5 /100 | #153 | Good 6.0% |
| Immigrants | Croatia | 75.1 /100 | #154 | Good 6.0% |
| Immigrants | Scotland | 72.1 /100 | #155 | Good 6.0% |
| Northern Europeans | 71.8 /100 | #156 | Good 6.0% |
| Ghanaians | 71.3 /100 | #157 | Good 6.0% |
| Immigrants | Fiji | 71.2 /100 | #158 | Good 6.0% |
| Immigrants | Latvia | 71.1 /100 | #159 | Good 6.0% |
| Central Americans | 69.8 /100 | #160 | Good 6.0% |
| Immigrants | Belarus | 69.2 /100 | #161 | Good 6.1% |
| Nigerians | 67.1 /100 | #162 | Good 6.1% |
| Lebanese | 66.2 /100 | #163 | Good 6.1% |
| Basques | 63.7 /100 | #164 | Good 6.1% |
| Nicaraguans | 63.2 /100 | #165 | Good 6.1% |
| Iraqis | 62.8 /100 | #166 | Good 6.1% |