Zimbabwean vs Immigrants from Nicaragua Ambulatory Disability
COMPARE
Zimbabwean
Immigrants from Nicaragua
Ambulatory Disability
Ambulatory Disability Comparison
Zimbabweans
Immigrants from Nicaragua
5.4%
AMBULATORY DISABILITY
100.0/ 100
METRIC RATING
25th/ 347
METRIC RANK
6.1%
AMBULATORY DISABILITY
43.9/ 100
METRIC RATING
180th/ 347
METRIC RANK
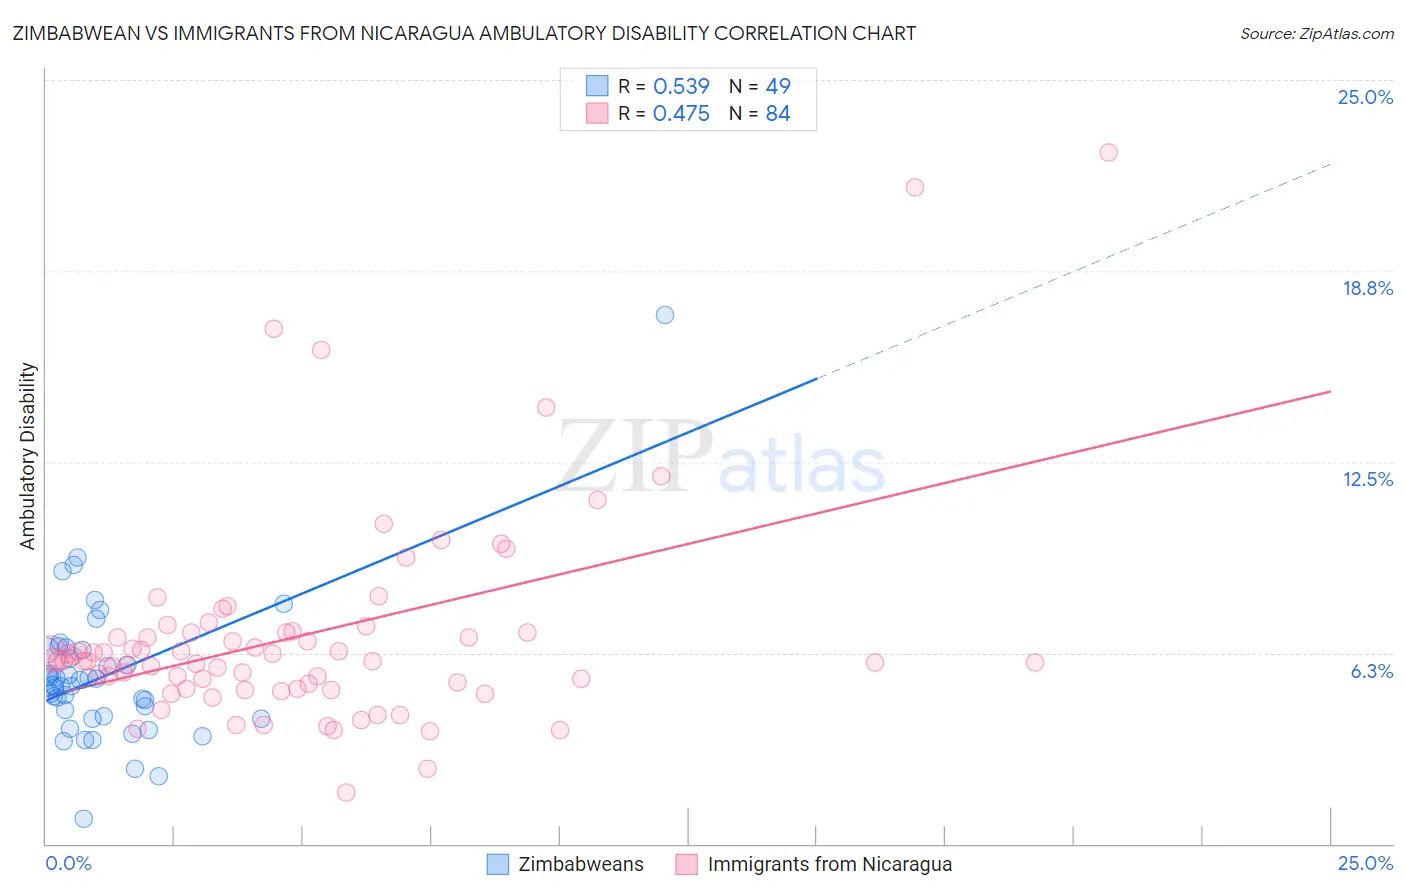
Zimbabwean vs Immigrants from Nicaragua Ambulatory Disability Correlation Chart
The statistical analysis conducted on geographies consisting of 69,187,176 people shows a substantial positive correlation between the proportion of Zimbabweans and percentage of population with ambulatory disability in the United States with a correlation coefficient (R) of 0.539 and weighted average of 5.4%. Similarly, the statistical analysis conducted on geographies consisting of 236,322,252 people shows a moderate positive correlation between the proportion of Immigrants from Nicaragua and percentage of population with ambulatory disability in the United States with a correlation coefficient (R) of 0.475 and weighted average of 6.1%, a difference of 13.8%.
Ambulatory Disability Correlation Summary
| Measurement | Zimbabwean | Immigrants from Nicaragua |
| Minimum | 0.83% | 1.7% |
| Maximum | 17.3% | 22.6% |
| Range | 16.5% | 20.9% |
| Mean | 5.5% | 6.8% |
| Median | 5.2% | 6.0% |
| Interquartile 25% (IQ1) | 4.1% | 5.2% |
| Interquartile 75% (IQ3) | 6.4% | 6.9% |
| Interquartile Range (IQR) | 2.2% | 1.7% |
| Standard Deviation (Sample) | 2.4% | 3.5% |
| Standard Deviation (Population) | 2.4% | 3.5% |
Similar Demographics by Ambulatory Disability
Demographics Similar to Zimbabweans by Ambulatory Disability
In terms of ambulatory disability, the demographic groups most similar to Zimbabweans are Immigrants from Nepal (5.4%, a difference of 0.030%), Immigrants from Saudi Arabia (5.4%, a difference of 0.080%), Tongan (5.4%, a difference of 0.17%), Asian (5.4%, a difference of 0.19%), and Immigrants from Israel (5.4%, a difference of 0.21%).
| Demographics | Rating | Rank | Ambulatory Disability |
| Immigrants | Sri Lanka | 100.0 /100 | #18 | Exceptional 5.4% |
| Indians (Asian) | 100.0 /100 | #19 | Exceptional 5.4% |
| Ethiopians | 100.0 /100 | #20 | Exceptional 5.4% |
| Immigrants | Kuwait | 100.0 /100 | #21 | Exceptional 5.4% |
| Immigrants | Israel | 100.0 /100 | #22 | Exceptional 5.4% |
| Tongans | 100.0 /100 | #23 | Exceptional 5.4% |
| Immigrants | Saudi Arabia | 100.0 /100 | #24 | Exceptional 5.4% |
| Zimbabweans | 100.0 /100 | #25 | Exceptional 5.4% |
| Immigrants | Nepal | 100.0 /100 | #26 | Exceptional 5.4% |
| Asians | 100.0 /100 | #27 | Exceptional 5.4% |
| Cambodians | 100.0 /100 | #28 | Exceptional 5.4% |
| Immigrants | Iran | 100.0 /100 | #29 | Exceptional 5.4% |
| Immigrants | Turkey | 100.0 /100 | #30 | Exceptional 5.4% |
| Immigrants | Venezuela | 100.0 /100 | #31 | Exceptional 5.4% |
| Immigrants | Australia | 100.0 /100 | #32 | Exceptional 5.5% |
Demographics Similar to Immigrants from Nicaragua by Ambulatory Disability
In terms of ambulatory disability, the demographic groups most similar to Immigrants from Nicaragua are Austrian (6.1%, a difference of 0.010%), Scandinavian (6.1%, a difference of 0.030%), Swiss (6.1%, a difference of 0.040%), Serbian (6.1%, a difference of 0.060%), and Immigrants from England (6.1%, a difference of 0.080%).
| Demographics | Rating | Rank | Ambulatory Disability |
| Croatians | 51.2 /100 | #173 | Average 6.1% |
| Immigrants | Canada | 50.0 /100 | #174 | Average 6.1% |
| Vietnamese | 47.2 /100 | #175 | Average 6.1% |
| Immigrants | North America | 45.6 /100 | #176 | Average 6.1% |
| Immigrants | England | 45.4 /100 | #177 | Average 6.1% |
| Scandinavians | 44.5 /100 | #178 | Average 6.1% |
| Austrians | 44.1 /100 | #179 | Average 6.1% |
| Immigrants | Nicaragua | 43.9 /100 | #180 | Average 6.1% |
| Swiss | 43.1 /100 | #181 | Average 6.1% |
| Serbians | 42.8 /100 | #182 | Average 6.1% |
| Immigrants | Thailand | 42.2 /100 | #183 | Average 6.1% |
| Immigrants | Ghana | 41.2 /100 | #184 | Average 6.1% |
| Immigrants | Bosnia and Herzegovina | 37.2 /100 | #185 | Fair 6.2% |
| Europeans | 36.2 /100 | #186 | Fair 6.2% |
| Carpatho Rusyns | 35.3 /100 | #187 | Fair 6.2% |