Ute vs Immigrants from Latvia Ambulatory Disability
COMPARE
Ute
Immigrants from Latvia
Ambulatory Disability
Ambulatory Disability Comparison
Ute
Immigrants from Latvia
6.0%
AMBULATORY DISABILITY
86.6/ 100
METRIC RATING
134th/ 347
METRIC RANK
6.0%
AMBULATORY DISABILITY
71.1/ 100
METRIC RATING
159th/ 347
METRIC RANK
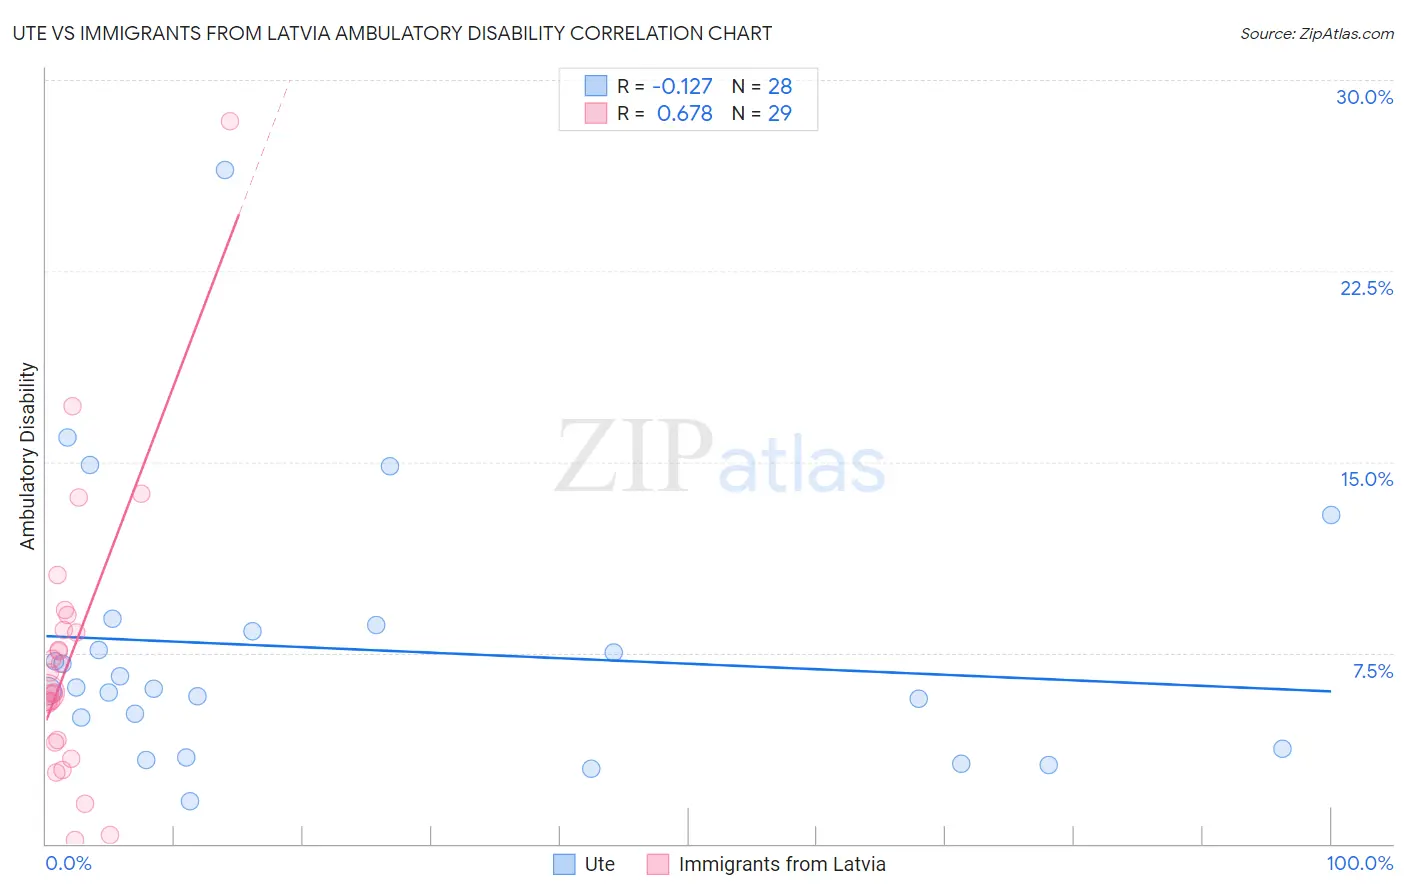
Ute vs Immigrants from Latvia Ambulatory Disability Correlation Chart
The statistical analysis conducted on geographies consisting of 55,667,207 people shows a poor negative correlation between the proportion of Ute and percentage of population with ambulatory disability in the United States with a correlation coefficient (R) of -0.127 and weighted average of 6.0%. Similarly, the statistical analysis conducted on geographies consisting of 113,736,193 people shows a significant positive correlation between the proportion of Immigrants from Latvia and percentage of population with ambulatory disability in the United States with a correlation coefficient (R) of 0.678 and weighted average of 6.0%, a difference of 1.3%.
Ambulatory Disability Correlation Summary
| Measurement | Ute | Immigrants from Latvia |
| Minimum | 1.7% | 0.16% |
| Maximum | 26.5% | 28.4% |
| Range | 24.8% | 28.2% |
| Mean | 7.6% | 7.4% |
| Median | 6.1% | 6.0% |
| Interquartile 25% (IQ1) | 4.3% | 4.0% |
| Interquartile 75% (IQ3) | 8.5% | 8.7% |
| Interquartile Range (IQR) | 4.1% | 4.7% |
| Standard Deviation (Sample) | 5.2% | 5.6% |
| Standard Deviation (Population) | 5.1% | 5.5% |
Similar Demographics by Ambulatory Disability
Demographics Similar to Ute by Ambulatory Disability
In terms of ambulatory disability, the demographic groups most similar to Ute are Immigrants (6.0%, a difference of 0.040%), Immigrants from Europe (6.0%, a difference of 0.15%), Immigrants from Italy (6.0%, a difference of 0.18%), Immigrants from North Macedonia (6.0%, a difference of 0.27%), and Immigrants from Syria (6.0%, a difference of 0.27%).
| Demographics | Rating | Rank | Ambulatory Disability |
| Immigrants | Nigeria | 90.9 /100 | #127 | Exceptional 5.9% |
| Immigrants | Western Asia | 90.7 /100 | #128 | Exceptional 5.9% |
| Immigrants | Norway | 90.5 /100 | #129 | Exceptional 5.9% |
| Immigrants | Kazakhstan | 89.7 /100 | #130 | Excellent 5.9% |
| Immigrants | Costa Rica | 89.5 /100 | #131 | Excellent 5.9% |
| Immigrants | Europe | 87.8 /100 | #132 | Excellent 6.0% |
| Immigrants | Immigrants | 86.9 /100 | #133 | Excellent 6.0% |
| Ute | 86.6 /100 | #134 | Excellent 6.0% |
| Immigrants | Italy | 85.0 /100 | #135 | Excellent 6.0% |
| Immigrants | North Macedonia | 84.1 /100 | #136 | Excellent 6.0% |
| Immigrants | Syria | 84.1 /100 | #137 | Excellent 6.0% |
| Immigrants | Hungary | 83.9 /100 | #138 | Excellent 6.0% |
| Immigrants | Zaire | 83.6 /100 | #139 | Excellent 6.0% |
| Czechs | 83.3 /100 | #140 | Excellent 6.0% |
| Swedes | 83.1 /100 | #141 | Excellent 6.0% |
Demographics Similar to Immigrants from Latvia by Ambulatory Disability
In terms of ambulatory disability, the demographic groups most similar to Immigrants from Latvia are Immigrants from Fiji (6.0%, a difference of 0.010%), Ghanaian (6.0%, a difference of 0.020%), Northern European (6.0%, a difference of 0.050%), Immigrants from Scotland (6.0%, a difference of 0.070%), and Central American (6.0%, a difference of 0.080%).
| Demographics | Rating | Rank | Ambulatory Disability |
| Immigrants | Austria | 78.8 /100 | #152 | Good 6.0% |
| Syrians | 75.5 /100 | #153 | Good 6.0% |
| Immigrants | Croatia | 75.1 /100 | #154 | Good 6.0% |
| Immigrants | Scotland | 72.1 /100 | #155 | Good 6.0% |
| Northern Europeans | 71.8 /100 | #156 | Good 6.0% |
| Ghanaians | 71.3 /100 | #157 | Good 6.0% |
| Immigrants | Fiji | 71.2 /100 | #158 | Good 6.0% |
| Immigrants | Latvia | 71.1 /100 | #159 | Good 6.0% |
| Central Americans | 69.8 /100 | #160 | Good 6.0% |
| Immigrants | Belarus | 69.2 /100 | #161 | Good 6.1% |
| Nigerians | 67.1 /100 | #162 | Good 6.1% |
| Lebanese | 66.2 /100 | #163 | Good 6.1% |
| Basques | 63.7 /100 | #164 | Good 6.1% |
| Nicaraguans | 63.2 /100 | #165 | Good 6.1% |
| Iraqis | 62.8 /100 | #166 | Good 6.1% |