Potawatomi vs Immigrants from Latvia Ambulatory Disability
COMPARE
Potawatomi
Immigrants from Latvia
Ambulatory Disability
Ambulatory Disability Comparison
Potawatomi
Immigrants from Latvia
7.3%
AMBULATORY DISABILITY
0.0/ 100
METRIC RATING
320th/ 347
METRIC RANK
6.0%
AMBULATORY DISABILITY
71.1/ 100
METRIC RATING
159th/ 347
METRIC RANK
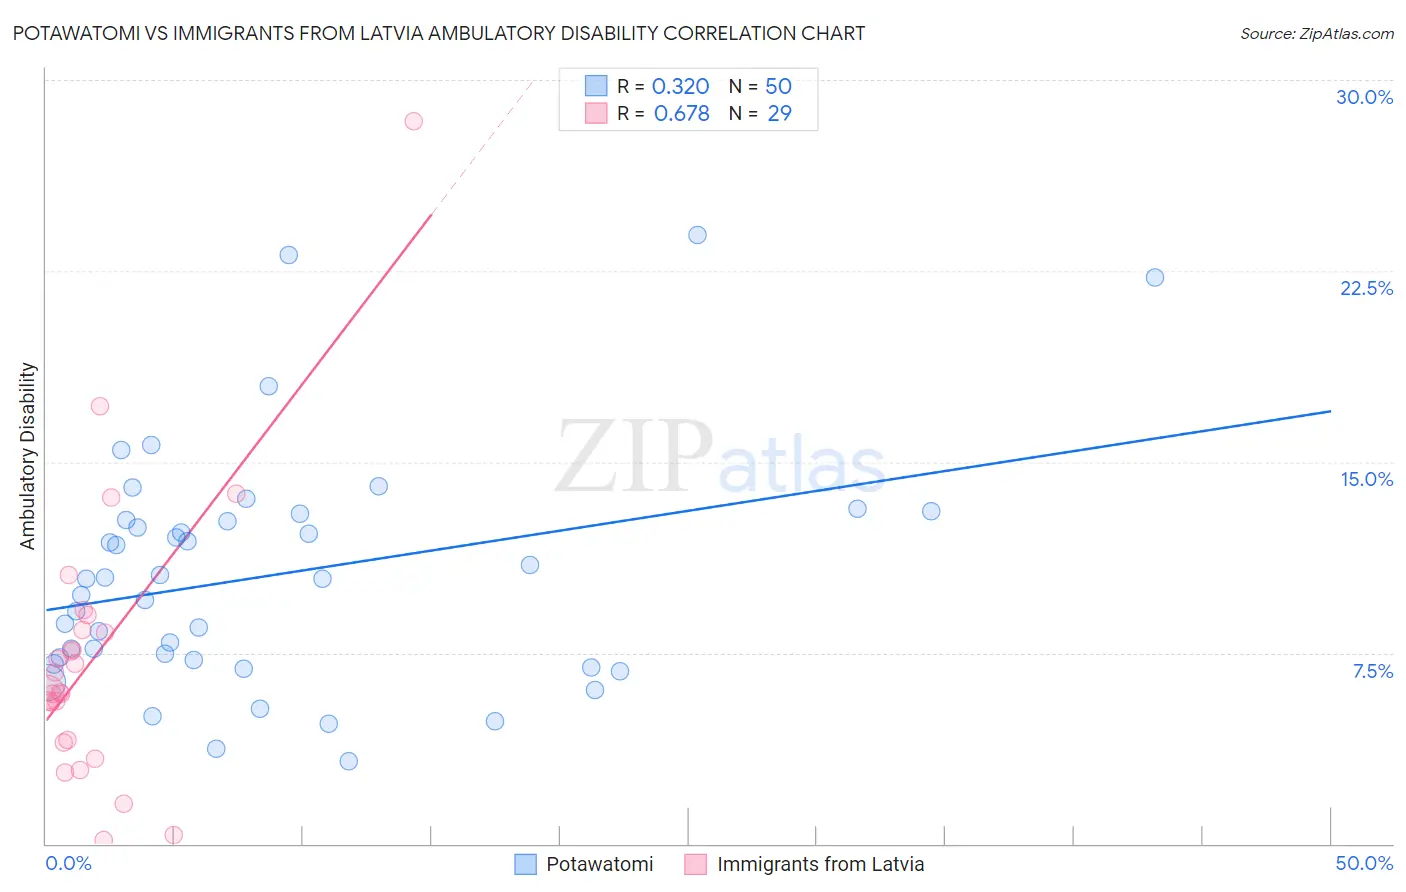
Potawatomi vs Immigrants from Latvia Ambulatory Disability Correlation Chart
The statistical analysis conducted on geographies consisting of 117,764,729 people shows a mild positive correlation between the proportion of Potawatomi and percentage of population with ambulatory disability in the United States with a correlation coefficient (R) of 0.320 and weighted average of 7.3%. Similarly, the statistical analysis conducted on geographies consisting of 113,736,193 people shows a significant positive correlation between the proportion of Immigrants from Latvia and percentage of population with ambulatory disability in the United States with a correlation coefficient (R) of 0.678 and weighted average of 6.0%, a difference of 21.1%.
Ambulatory Disability Correlation Summary
| Measurement | Potawatomi | Immigrants from Latvia |
| Minimum | 3.3% | 0.16% |
| Maximum | 23.9% | 28.4% |
| Range | 20.7% | 28.2% |
| Mean | 10.6% | 7.4% |
| Median | 10.4% | 6.0% |
| Interquartile 25% (IQ1) | 7.2% | 4.0% |
| Interquartile 75% (IQ3) | 12.7% | 8.7% |
| Interquartile Range (IQR) | 5.5% | 4.7% |
| Standard Deviation (Sample) | 4.6% | 5.6% |
| Standard Deviation (Population) | 4.6% | 5.5% |
Similar Demographics by Ambulatory Disability
Demographics Similar to Potawatomi by Ambulatory Disability
In terms of ambulatory disability, the demographic groups most similar to Potawatomi are Apache (7.4%, a difference of 0.81%), Osage (7.4%, a difference of 0.95%), American (7.4%, a difference of 1.2%), Dominican (7.2%, a difference of 1.9%), and Ottawa (7.2%, a difference of 2.2%).
| Demographics | Rating | Rank | Ambulatory Disability |
| Immigrants | Yemen | 0.0 /100 | #313 | Tragic 7.1% |
| Blackfeet | 0.0 /100 | #314 | Tragic 7.1% |
| Shoshone | 0.0 /100 | #315 | Tragic 7.1% |
| Immigrants | Dominican Republic | 0.0 /100 | #316 | Tragic 7.1% |
| Central American Indians | 0.0 /100 | #317 | Tragic 7.2% |
| Ottawa | 0.0 /100 | #318 | Tragic 7.2% |
| Dominicans | 0.0 /100 | #319 | Tragic 7.2% |
| Potawatomi | 0.0 /100 | #320 | Tragic 7.3% |
| Apache | 0.0 /100 | #321 | Tragic 7.4% |
| Osage | 0.0 /100 | #322 | Tragic 7.4% |
| Americans | 0.0 /100 | #323 | Tragic 7.4% |
| Navajo | 0.0 /100 | #324 | Tragic 7.5% |
| Comanche | 0.0 /100 | #325 | Tragic 7.5% |
| Blacks/African Americans | 0.0 /100 | #326 | Tragic 7.5% |
| Natives/Alaskans | 0.0 /100 | #327 | Tragic 7.5% |
Demographics Similar to Immigrants from Latvia by Ambulatory Disability
In terms of ambulatory disability, the demographic groups most similar to Immigrants from Latvia are Immigrants from Fiji (6.0%, a difference of 0.010%), Ghanaian (6.0%, a difference of 0.020%), Northern European (6.0%, a difference of 0.050%), Immigrants from Scotland (6.0%, a difference of 0.070%), and Central American (6.0%, a difference of 0.080%).
| Demographics | Rating | Rank | Ambulatory Disability |
| Immigrants | Austria | 78.8 /100 | #152 | Good 6.0% |
| Syrians | 75.5 /100 | #153 | Good 6.0% |
| Immigrants | Croatia | 75.1 /100 | #154 | Good 6.0% |
| Immigrants | Scotland | 72.1 /100 | #155 | Good 6.0% |
| Northern Europeans | 71.8 /100 | #156 | Good 6.0% |
| Ghanaians | 71.3 /100 | #157 | Good 6.0% |
| Immigrants | Fiji | 71.2 /100 | #158 | Good 6.0% |
| Immigrants | Latvia | 71.1 /100 | #159 | Good 6.0% |
| Central Americans | 69.8 /100 | #160 | Good 6.0% |
| Immigrants | Belarus | 69.2 /100 | #161 | Good 6.1% |
| Nigerians | 67.1 /100 | #162 | Good 6.1% |
| Lebanese | 66.2 /100 | #163 | Good 6.1% |
| Basques | 63.7 /100 | #164 | Good 6.1% |
| Nicaraguans | 63.2 /100 | #165 | Good 6.1% |
| Iraqis | 62.8 /100 | #166 | Good 6.1% |