Zimbabwean vs Immigrants from Liberia Ambulatory Disability
COMPARE
Zimbabwean
Immigrants from Liberia
Ambulatory Disability
Ambulatory Disability Comparison
Zimbabweans
Immigrants from Liberia
5.4%
AMBULATORY DISABILITY
100.0/ 100
METRIC RATING
25th/ 347
METRIC RANK
6.4%
AMBULATORY DISABILITY
2.3/ 100
METRIC RATING
234th/ 347
METRIC RANK
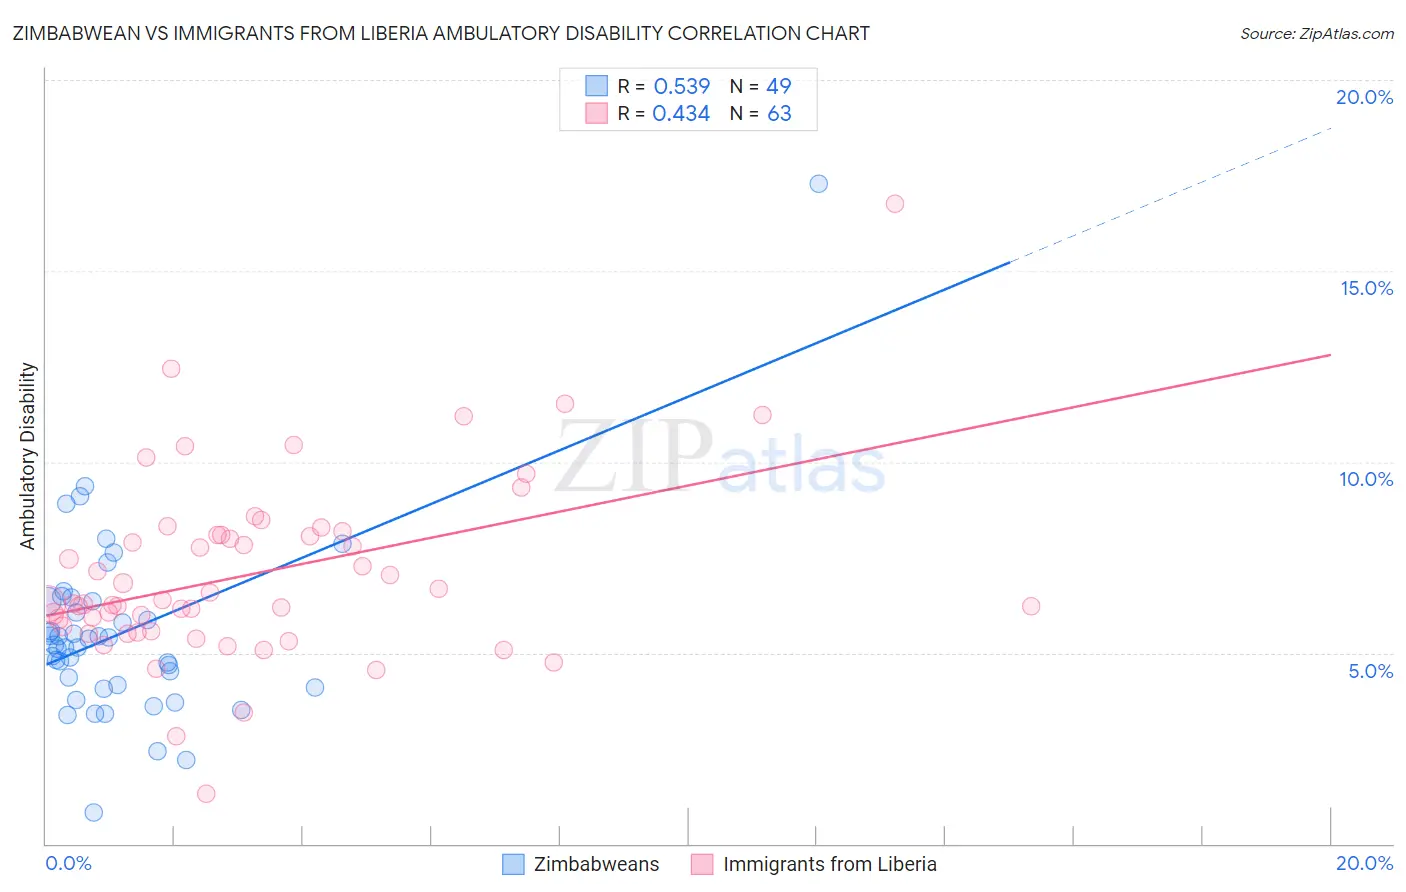
Zimbabwean vs Immigrants from Liberia Ambulatory Disability Correlation Chart
The statistical analysis conducted on geographies consisting of 69,187,176 people shows a substantial positive correlation between the proportion of Zimbabweans and percentage of population with ambulatory disability in the United States with a correlation coefficient (R) of 0.539 and weighted average of 5.4%. Similarly, the statistical analysis conducted on geographies consisting of 135,254,845 people shows a moderate positive correlation between the proportion of Immigrants from Liberia and percentage of population with ambulatory disability in the United States with a correlation coefficient (R) of 0.434 and weighted average of 6.4%, a difference of 19.1%.
Ambulatory Disability Correlation Summary
| Measurement | Zimbabwean | Immigrants from Liberia |
| Minimum | 0.83% | 1.3% |
| Maximum | 17.3% | 16.8% |
| Range | 16.5% | 15.5% |
| Mean | 5.5% | 7.1% |
| Median | 5.2% | 6.3% |
| Interquartile 25% (IQ1) | 4.1% | 5.6% |
| Interquartile 75% (IQ3) | 6.4% | 8.1% |
| Interquartile Range (IQR) | 2.2% | 2.5% |
| Standard Deviation (Sample) | 2.4% | 2.4% |
| Standard Deviation (Population) | 2.4% | 2.4% |
Similar Demographics by Ambulatory Disability
Demographics Similar to Zimbabweans by Ambulatory Disability
In terms of ambulatory disability, the demographic groups most similar to Zimbabweans are Immigrants from Nepal (5.4%, a difference of 0.030%), Immigrants from Saudi Arabia (5.4%, a difference of 0.080%), Tongan (5.4%, a difference of 0.17%), Asian (5.4%, a difference of 0.19%), and Immigrants from Israel (5.4%, a difference of 0.21%).
| Demographics | Rating | Rank | Ambulatory Disability |
| Immigrants | Sri Lanka | 100.0 /100 | #18 | Exceptional 5.4% |
| Indians (Asian) | 100.0 /100 | #19 | Exceptional 5.4% |
| Ethiopians | 100.0 /100 | #20 | Exceptional 5.4% |
| Immigrants | Kuwait | 100.0 /100 | #21 | Exceptional 5.4% |
| Immigrants | Israel | 100.0 /100 | #22 | Exceptional 5.4% |
| Tongans | 100.0 /100 | #23 | Exceptional 5.4% |
| Immigrants | Saudi Arabia | 100.0 /100 | #24 | Exceptional 5.4% |
| Zimbabweans | 100.0 /100 | #25 | Exceptional 5.4% |
| Immigrants | Nepal | 100.0 /100 | #26 | Exceptional 5.4% |
| Asians | 100.0 /100 | #27 | Exceptional 5.4% |
| Cambodians | 100.0 /100 | #28 | Exceptional 5.4% |
| Immigrants | Iran | 100.0 /100 | #29 | Exceptional 5.4% |
| Immigrants | Turkey | 100.0 /100 | #30 | Exceptional 5.4% |
| Immigrants | Venezuela | 100.0 /100 | #31 | Exceptional 5.4% |
| Immigrants | Australia | 100.0 /100 | #32 | Exceptional 5.5% |
Demographics Similar to Immigrants from Liberia by Ambulatory Disability
In terms of ambulatory disability, the demographic groups most similar to Immigrants from Liberia are Subsaharan African (6.4%, a difference of 0.030%), Hispanic or Latino (6.4%, a difference of 0.030%), Assyrian/Chaldean/Syriac (6.4%, a difference of 0.090%), Dutch (6.4%, a difference of 0.18%), and Immigrants from Germany (6.4%, a difference of 0.27%).
| Demographics | Rating | Rank | Ambulatory Disability |
| Cubans | 4.0 /100 | #227 | Tragic 6.4% |
| Portuguese | 4.0 /100 | #228 | Tragic 6.4% |
| Czechoslovakians | 3.8 /100 | #229 | Tragic 6.4% |
| Mexicans | 3.5 /100 | #230 | Tragic 6.4% |
| Panamanians | 3.1 /100 | #231 | Tragic 6.4% |
| Assyrians/Chaldeans/Syriacs | 2.4 /100 | #232 | Tragic 6.4% |
| Sub-Saharan Africans | 2.3 /100 | #233 | Tragic 6.4% |
| Immigrants | Liberia | 2.3 /100 | #234 | Tragic 6.4% |
| Hispanics or Latinos | 2.2 /100 | #235 | Tragic 6.4% |
| Dutch | 2.0 /100 | #236 | Tragic 6.4% |
| Immigrants | Germany | 1.8 /100 | #237 | Tragic 6.4% |
| Haitians | 1.8 /100 | #238 | Tragic 6.4% |
| Senegalese | 1.7 /100 | #239 | Tragic 6.4% |
| Immigrants | Senegal | 1.7 /100 | #240 | Tragic 6.4% |
| Immigrants | Haiti | 1.6 /100 | #241 | Tragic 6.5% |