Zimbabwean vs Puget Sound Salish Ambulatory Disability
COMPARE
Zimbabwean
Puget Sound Salish
Ambulatory Disability
Ambulatory Disability Comparison
Zimbabweans
Puget Sound Salish
5.4%
AMBULATORY DISABILITY
100.0/ 100
METRIC RATING
25th/ 347
METRIC RANK
6.9%
AMBULATORY DISABILITY
0.0/ 100
METRIC RATING
299th/ 347
METRIC RANK
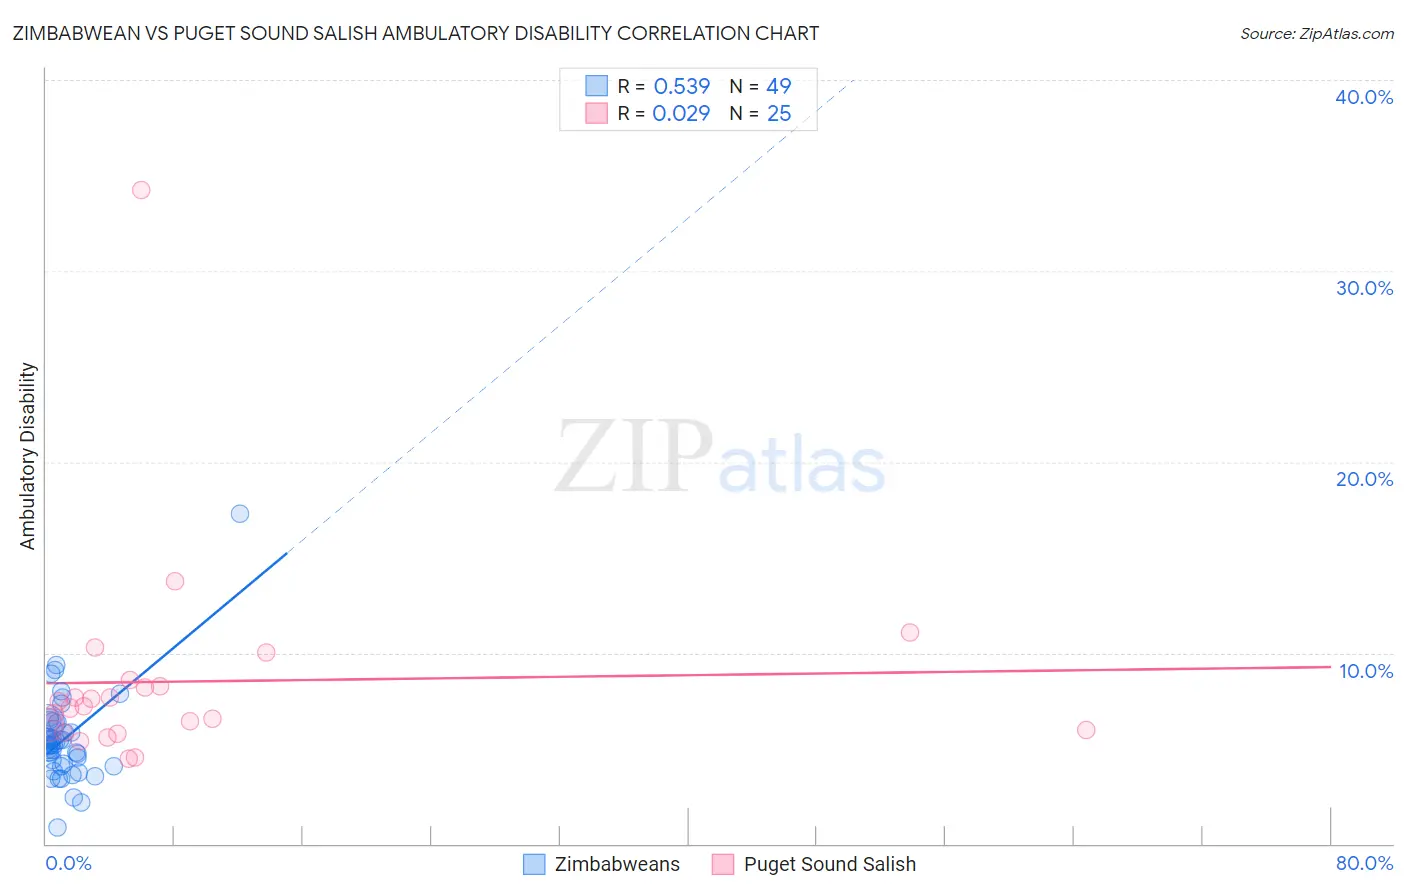
Zimbabwean vs Puget Sound Salish Ambulatory Disability Correlation Chart
The statistical analysis conducted on geographies consisting of 69,187,176 people shows a substantial positive correlation between the proportion of Zimbabweans and percentage of population with ambulatory disability in the United States with a correlation coefficient (R) of 0.539 and weighted average of 5.4%. Similarly, the statistical analysis conducted on geographies consisting of 46,152,398 people shows no correlation between the proportion of Puget Sound Salish and percentage of population with ambulatory disability in the United States with a correlation coefficient (R) of 0.029 and weighted average of 6.9%, a difference of 28.8%.
Ambulatory Disability Correlation Summary
| Measurement | Zimbabwean | Puget Sound Salish |
| Minimum | 0.83% | 4.5% |
| Maximum | 17.3% | 34.2% |
| Range | 16.5% | 29.7% |
| Mean | 5.5% | 8.5% |
| Median | 5.2% | 7.2% |
| Interquartile 25% (IQ1) | 4.1% | 5.9% |
| Interquartile 75% (IQ3) | 6.4% | 8.4% |
| Interquartile Range (IQR) | 2.2% | 2.5% |
| Standard Deviation (Sample) | 2.4% | 5.8% |
| Standard Deviation (Population) | 2.4% | 5.6% |
Similar Demographics by Ambulatory Disability
Demographics Similar to Zimbabweans by Ambulatory Disability
In terms of ambulatory disability, the demographic groups most similar to Zimbabweans are Immigrants from Nepal (5.4%, a difference of 0.030%), Immigrants from Saudi Arabia (5.4%, a difference of 0.080%), Tongan (5.4%, a difference of 0.17%), Asian (5.4%, a difference of 0.19%), and Immigrants from Israel (5.4%, a difference of 0.21%).
| Demographics | Rating | Rank | Ambulatory Disability |
| Immigrants | Sri Lanka | 100.0 /100 | #18 | Exceptional 5.4% |
| Indians (Asian) | 100.0 /100 | #19 | Exceptional 5.4% |
| Ethiopians | 100.0 /100 | #20 | Exceptional 5.4% |
| Immigrants | Kuwait | 100.0 /100 | #21 | Exceptional 5.4% |
| Immigrants | Israel | 100.0 /100 | #22 | Exceptional 5.4% |
| Tongans | 100.0 /100 | #23 | Exceptional 5.4% |
| Immigrants | Saudi Arabia | 100.0 /100 | #24 | Exceptional 5.4% |
| Zimbabweans | 100.0 /100 | #25 | Exceptional 5.4% |
| Immigrants | Nepal | 100.0 /100 | #26 | Exceptional 5.4% |
| Asians | 100.0 /100 | #27 | Exceptional 5.4% |
| Cambodians | 100.0 /100 | #28 | Exceptional 5.4% |
| Immigrants | Iran | 100.0 /100 | #29 | Exceptional 5.4% |
| Immigrants | Turkey | 100.0 /100 | #30 | Exceptional 5.4% |
| Immigrants | Venezuela | 100.0 /100 | #31 | Exceptional 5.4% |
| Immigrants | Australia | 100.0 /100 | #32 | Exceptional 5.5% |
Demographics Similar to Puget Sound Salish by Ambulatory Disability
In terms of ambulatory disability, the demographic groups most similar to Puget Sound Salish are Marshallese (6.9%, a difference of 0.010%), Immigrants from Grenada (6.9%, a difference of 0.13%), French American Indian (6.9%, a difference of 0.14%), British West Indian (7.0%, a difference of 0.24%), and Immigrants from Armenia (7.0%, a difference of 0.30%).
| Demographics | Rating | Rank | Ambulatory Disability |
| Cheyenne | 0.0 /100 | #292 | Tragic 6.9% |
| Immigrants | St. Vincent and the Grenadines | 0.0 /100 | #293 | Tragic 6.9% |
| Cape Verdeans | 0.0 /100 | #294 | Tragic 6.9% |
| Crow | 0.0 /100 | #295 | Tragic 6.9% |
| Alaskan Athabascans | 0.0 /100 | #296 | Tragic 6.9% |
| French American Indians | 0.0 /100 | #297 | Tragic 6.9% |
| Immigrants | Grenada | 0.0 /100 | #298 | Tragic 6.9% |
| Puget Sound Salish | 0.0 /100 | #299 | Tragic 6.9% |
| Marshallese | 0.0 /100 | #300 | Tragic 6.9% |
| British West Indians | 0.0 /100 | #301 | Tragic 7.0% |
| Immigrants | Armenia | 0.0 /100 | #302 | Tragic 7.0% |
| Africans | 0.0 /100 | #303 | Tragic 7.0% |
| Immigrants | Cabo Verde | 0.0 /100 | #304 | Tragic 7.0% |
| Immigrants | Micronesia | 0.0 /100 | #305 | Tragic 7.0% |
| Iroquois | 0.0 /100 | #306 | Tragic 7.1% |