Zimbabwean vs Immigrants from Latvia Female Poverty Among 18-24 Year Olds
COMPARE
Zimbabwean
Immigrants from Latvia
Female Poverty Among 18-24 Year Olds
Female Poverty Among 18-24 Year Olds Comparison
Zimbabweans
Immigrants from Latvia
20.4%
FEMALE POVERTY AMONG 18-24 YEAR OLDS
21.0/ 100
METRIC RATING
197th/ 347
METRIC RANK
20.4%
FEMALE POVERTY AMONG 18-24 YEAR OLDS
23.0/ 100
METRIC RATING
195th/ 347
METRIC RANK
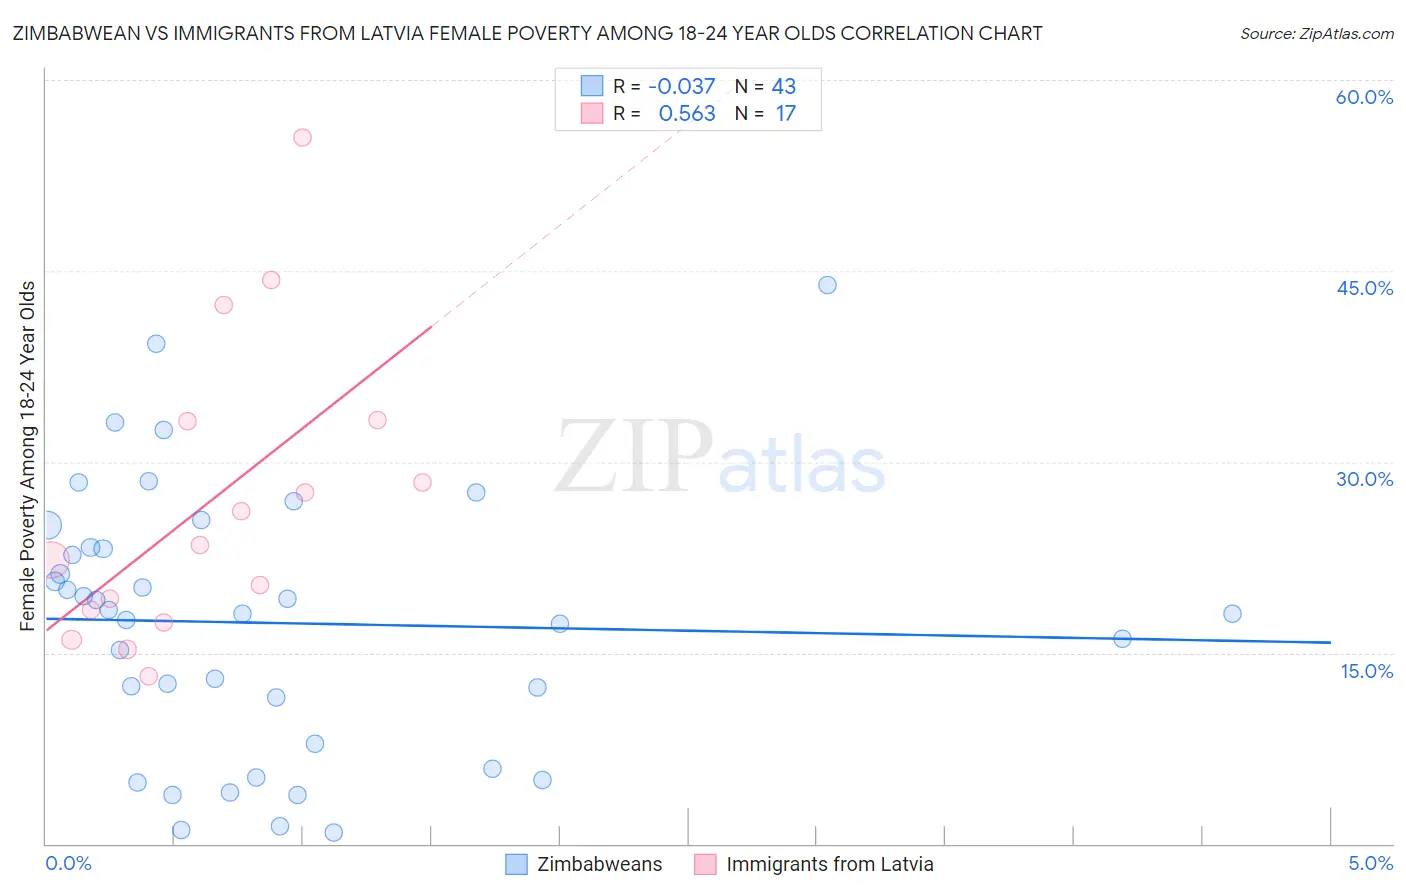
Zimbabwean vs Immigrants from Latvia Female Poverty Among 18-24 Year Olds Correlation Chart
The statistical analysis conducted on geographies consisting of 68,868,173 people shows no correlation between the proportion of Zimbabweans and poverty level among females between the ages 18 and 24 in the United States with a correlation coefficient (R) of -0.037 and weighted average of 20.4%. Similarly, the statistical analysis conducted on geographies consisting of 112,426,686 people shows a substantial positive correlation between the proportion of Immigrants from Latvia and poverty level among females between the ages 18 and 24 in the United States with a correlation coefficient (R) of 0.563 and weighted average of 20.4%, a difference of 0.14%.
Female Poverty Among 18-24 Year Olds Correlation Summary
| Measurement | Zimbabwean | Immigrants from Latvia |
| Minimum | 0.87% | 13.2% |
| Maximum | 43.9% | 55.5% |
| Range | 43.0% | 42.3% |
| Mean | 17.3% | 26.8% |
| Median | 18.1% | 23.5% |
| Interquartile 25% (IQ1) | 7.9% | 17.9% |
| Interquartile 75% (IQ3) | 23.3% | 33.3% |
| Interquartile Range (IQR) | 15.4% | 15.4% |
| Standard Deviation (Sample) | 10.4% | 11.7% |
| Standard Deviation (Population) | 10.3% | 11.3% |
Demographics Similar to Zimbabweans and Immigrants from Latvia by Female Poverty Among 18-24 Year Olds
In terms of female poverty among 18-24 year olds, the demographic groups most similar to Zimbabweans are Immigrants from Spain (20.4%, a difference of 0.020%), German (20.4%, a difference of 0.030%), European (20.4%, a difference of 0.080%), Czech (20.4%, a difference of 0.090%), and Mexican American Indian (20.4%, a difference of 0.15%). Similarly, the demographic groups most similar to Immigrants from Latvia are Mexican American Indian (20.4%, a difference of 0.010%), Nigerian (20.4%, a difference of 0.030%), Czech (20.4%, a difference of 0.050%), Immigrants from Israel (20.4%, a difference of 0.10%), and Immigrants from Spain (20.4%, a difference of 0.16%).
| Demographics | Rating | Rank | Female Poverty Among 18-24 Year Olds |
| Immigrants | Ethiopia | 37.3 /100 | #186 | Fair 20.2% |
| Immigrants | Mexico | 36.3 /100 | #187 | Fair 20.2% |
| Scandinavians | 34.6 /100 | #188 | Fair 20.3% |
| Immigrants | Germany | 34.0 /100 | #189 | Fair 20.3% |
| Immigrants | Western Asia | 29.3 /100 | #190 | Fair 20.3% |
| Moroccans | 25.8 /100 | #191 | Fair 20.4% |
| Immigrants | Israel | 24.4 /100 | #192 | Fair 20.4% |
| Nigerians | 23.4 /100 | #193 | Fair 20.4% |
| Mexican American Indians | 23.2 /100 | #194 | Fair 20.4% |
| Immigrants | Latvia | 23.0 /100 | #195 | Fair 20.4% |
| Czechs | 22.3 /100 | #196 | Fair 20.4% |
| Zimbabweans | 21.0 /100 | #197 | Fair 20.4% |
| Immigrants | Spain | 20.7 /100 | #198 | Fair 20.4% |
| Germans | 20.6 /100 | #199 | Fair 20.4% |
| Europeans | 19.9 /100 | #200 | Poor 20.4% |
| Mexicans | 18.3 /100 | #201 | Poor 20.5% |
| Immigrants | Turkey | 17.7 /100 | #202 | Poor 20.5% |
| Immigrants | Malaysia | 17.2 /100 | #203 | Poor 20.5% |
| Immigrants | Netherlands | 17.0 /100 | #204 | Poor 20.5% |
| English | 16.7 /100 | #205 | Poor 20.5% |
| Hispanics or Latinos | 16.6 /100 | #206 | Poor 20.5% |