Malaysian vs Immigrants from Latvia Ambulatory Disability
COMPARE
Malaysian
Immigrants from Latvia
Ambulatory Disability
Ambulatory Disability Comparison
Malaysians
Immigrants from Latvia
6.2%
AMBULATORY DISABILITY
28.2/ 100
METRIC RATING
196th/ 347
METRIC RANK
6.0%
AMBULATORY DISABILITY
71.1/ 100
METRIC RATING
159th/ 347
METRIC RANK
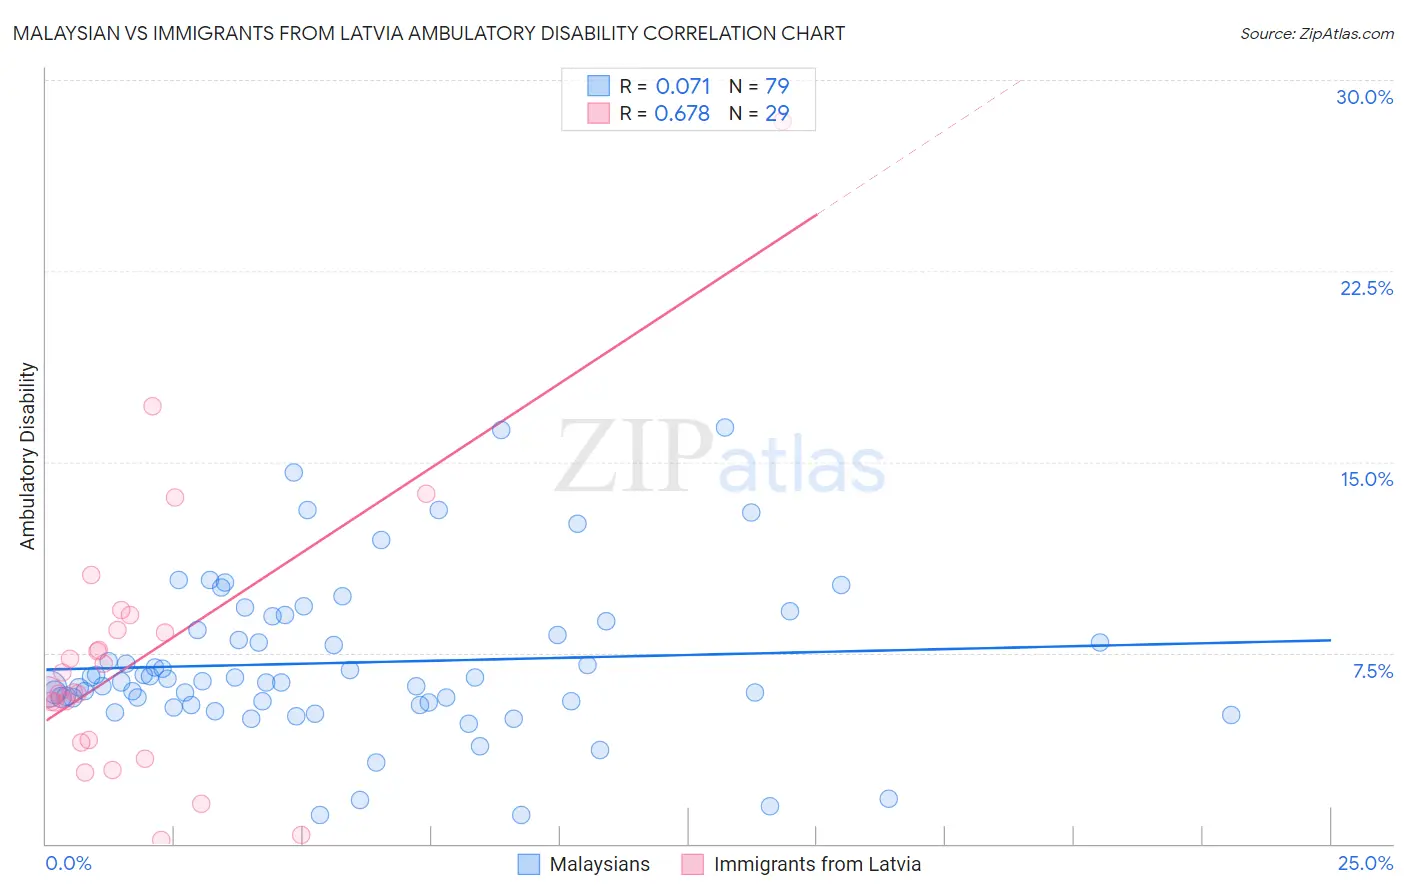
Malaysian vs Immigrants from Latvia Ambulatory Disability Correlation Chart
The statistical analysis conducted on geographies consisting of 226,050,790 people shows a slight positive correlation between the proportion of Malaysians and percentage of population with ambulatory disability in the United States with a correlation coefficient (R) of 0.071 and weighted average of 6.2%. Similarly, the statistical analysis conducted on geographies consisting of 113,736,193 people shows a significant positive correlation between the proportion of Immigrants from Latvia and percentage of population with ambulatory disability in the United States with a correlation coefficient (R) of 0.678 and weighted average of 6.0%, a difference of 2.5%.
Ambulatory Disability Correlation Summary
| Measurement | Malaysian | Immigrants from Latvia |
| Minimum | 1.1% | 0.16% |
| Maximum | 16.3% | 28.4% |
| Range | 15.2% | 28.2% |
| Mean | 7.1% | 7.4% |
| Median | 6.4% | 6.0% |
| Interquartile 25% (IQ1) | 5.6% | 4.0% |
| Interquartile 75% (IQ3) | 8.8% | 8.7% |
| Interquartile Range (IQR) | 3.2% | 4.7% |
| Standard Deviation (Sample) | 3.1% | 5.6% |
| Standard Deviation (Population) | 3.1% | 5.5% |
Similar Demographics by Ambulatory Disability
Demographics Similar to Malaysians by Ambulatory Disability
In terms of ambulatory disability, the demographic groups most similar to Malaysians are Belgian (6.2%, a difference of 0.030%), Alaska Native (6.2%, a difference of 0.10%), Guatemalan (6.2%, a difference of 0.11%), Polish (6.2%, a difference of 0.12%), and Immigrants from Western Europe (6.2%, a difference of 0.21%).
| Demographics | Rating | Rank | Ambulatory Disability |
| Ukrainians | 34.0 /100 | #189 | Fair 6.2% |
| Immigrants | Western Africa | 33.4 /100 | #190 | Fair 6.2% |
| Immigrants | Guatemala | 31.9 /100 | #191 | Fair 6.2% |
| Immigrants | Western Europe | 31.6 /100 | #192 | Fair 6.2% |
| Guatemalans | 30.0 /100 | #193 | Fair 6.2% |
| Alaska Natives | 29.8 /100 | #194 | Fair 6.2% |
| Belgians | 28.6 /100 | #195 | Fair 6.2% |
| Malaysians | 28.2 /100 | #196 | Fair 6.2% |
| Poles | 26.3 /100 | #197 | Fair 6.2% |
| Immigrants | Bangladesh | 24.6 /100 | #198 | Fair 6.2% |
| Italians | 22.6 /100 | #199 | Fair 6.2% |
| Immigrants | Cambodia | 21.5 /100 | #200 | Fair 6.2% |
| Immigrants | Central America | 20.1 /100 | #201 | Fair 6.2% |
| Albanians | 19.7 /100 | #202 | Poor 6.2% |
| Immigrants | Ukraine | 18.4 /100 | #203 | Poor 6.2% |
Demographics Similar to Immigrants from Latvia by Ambulatory Disability
In terms of ambulatory disability, the demographic groups most similar to Immigrants from Latvia are Immigrants from Fiji (6.0%, a difference of 0.010%), Ghanaian (6.0%, a difference of 0.020%), Northern European (6.0%, a difference of 0.050%), Immigrants from Scotland (6.0%, a difference of 0.070%), and Central American (6.0%, a difference of 0.080%).
| Demographics | Rating | Rank | Ambulatory Disability |
| Immigrants | Austria | 78.8 /100 | #152 | Good 6.0% |
| Syrians | 75.5 /100 | #153 | Good 6.0% |
| Immigrants | Croatia | 75.1 /100 | #154 | Good 6.0% |
| Immigrants | Scotland | 72.1 /100 | #155 | Good 6.0% |
| Northern Europeans | 71.8 /100 | #156 | Good 6.0% |
| Ghanaians | 71.3 /100 | #157 | Good 6.0% |
| Immigrants | Fiji | 71.2 /100 | #158 | Good 6.0% |
| Immigrants | Latvia | 71.1 /100 | #159 | Good 6.0% |
| Central Americans | 69.8 /100 | #160 | Good 6.0% |
| Immigrants | Belarus | 69.2 /100 | #161 | Good 6.1% |
| Nigerians | 67.1 /100 | #162 | Good 6.1% |
| Lebanese | 66.2 /100 | #163 | Good 6.1% |
| Basques | 63.7 /100 | #164 | Good 6.1% |
| Nicaraguans | 63.2 /100 | #165 | Good 6.1% |
| Iraqis | 62.8 /100 | #166 | Good 6.1% |