Yaqui vs Mexican Female Disability
COMPARE
Yaqui
Mexican
Female Disability
Female Disability Comparison
Yaqui
Mexicans
13.2%
FEMALE DISABILITY
0.0/ 100
METRIC RATING
287th/ 347
METRIC RANK
12.4%
FEMALE DISABILITY
15.7/ 100
METRIC RATING
209th/ 347
METRIC RANK
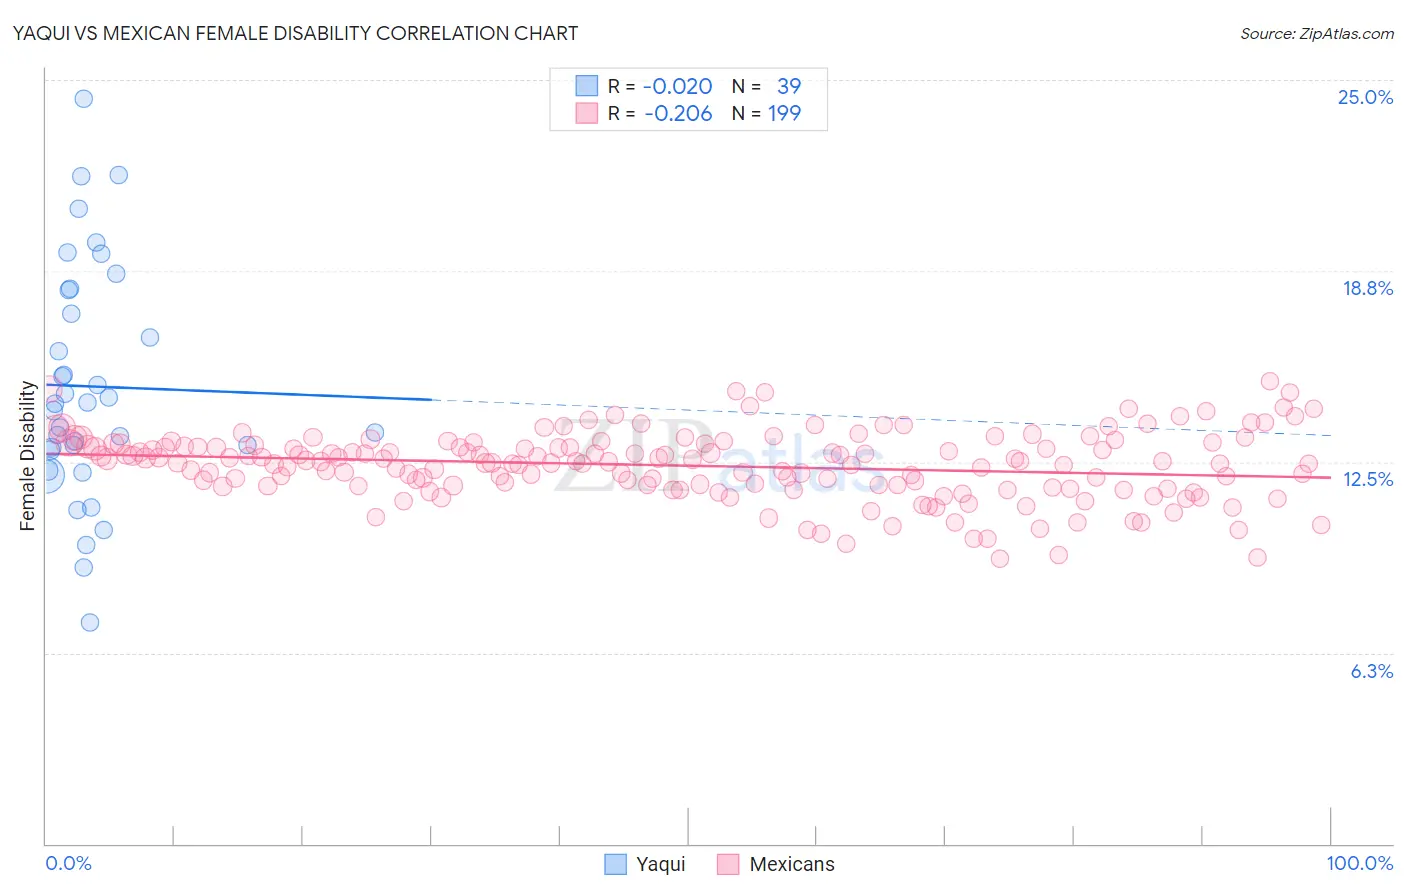
Yaqui vs Mexican Female Disability Correlation Chart
The statistical analysis conducted on geographies consisting of 107,719,665 people shows no correlation between the proportion of Yaqui and percentage of females with a disability in the United States with a correlation coefficient (R) of -0.020 and weighted average of 13.2%. Similarly, the statistical analysis conducted on geographies consisting of 564,937,802 people shows a weak negative correlation between the proportion of Mexicans and percentage of females with a disability in the United States with a correlation coefficient (R) of -0.206 and weighted average of 12.4%, a difference of 6.3%.
Female Disability Correlation Summary
| Measurement | Yaqui | Mexican |
| Minimum | 7.2% | 9.3% |
| Maximum | 24.4% | 15.1% |
| Range | 17.1% | 5.8% |
| Mean | 15.0% | 12.4% |
| Median | 14.4% | 12.5% |
| Interquartile 25% (IQ1) | 12.9% | 11.7% |
| Interquartile 75% (IQ3) | 18.1% | 13.0% |
| Interquartile Range (IQR) | 5.2% | 1.3% |
| Standard Deviation (Sample) | 3.8% | 1.1% |
| Standard Deviation (Population) | 3.8% | 1.1% |
Similar Demographics by Female Disability
Demographics Similar to Yaqui by Female Disability
In terms of female disability, the demographic groups most similar to Yaqui are White/Caucasian (13.2%, a difference of 0.10%), Tlingit-Haida (13.2%, a difference of 0.27%), Immigrants from Yemen (13.2%, a difference of 0.27%), Shoshone (13.2%, a difference of 0.34%), and Yakama (13.2%, a difference of 0.50%).
| Demographics | Rating | Rank | Female Disability |
| Irish | 0.1 /100 | #280 | Tragic 13.1% |
| U.S. Virgin Islanders | 0.1 /100 | #281 | Tragic 13.1% |
| Welsh | 0.0 /100 | #282 | Tragic 13.1% |
| English | 0.0 /100 | #283 | Tragic 13.1% |
| Hmong | 0.0 /100 | #284 | Tragic 13.1% |
| Bangladeshis | 0.0 /100 | #285 | Tragic 13.1% |
| Fijians | 0.0 /100 | #286 | Tragic 13.1% |
| Yaqui | 0.0 /100 | #287 | Tragic 13.2% |
| Whites/Caucasians | 0.0 /100 | #288 | Tragic 13.2% |
| Tlingit-Haida | 0.0 /100 | #289 | Tragic 13.2% |
| Immigrants | Yemen | 0.0 /100 | #290 | Tragic 13.2% |
| Shoshone | 0.0 /100 | #291 | Tragic 13.2% |
| Yakama | 0.0 /100 | #292 | Tragic 13.2% |
| Marshallese | 0.0 /100 | #293 | Tragic 13.3% |
| Celtics | 0.0 /100 | #294 | Tragic 13.3% |
Demographics Similar to Mexicans by Female Disability
In terms of female disability, the demographic groups most similar to Mexicans are Swiss (12.4%, a difference of 0.050%), Immigrants from Bosnia and Herzegovina (12.4%, a difference of 0.060%), Ute (12.4%, a difference of 0.070%), Immigrants from Thailand (12.4%, a difference of 0.090%), and Basque (12.4%, a difference of 0.12%).
| Demographics | Rating | Rank | Female Disability |
| Somalis | 21.5 /100 | #202 | Fair 12.3% |
| Immigrants | Barbados | 21.1 /100 | #203 | Fair 12.3% |
| Immigrants | Zaire | 20.9 /100 | #204 | Fair 12.3% |
| Immigrants | Grenada | 20.5 /100 | #205 | Fair 12.4% |
| Immigrants | Cuba | 20.2 /100 | #206 | Fair 12.4% |
| Croatians | 20.2 /100 | #207 | Fair 12.4% |
| Basques | 17.5 /100 | #208 | Poor 12.4% |
| Mexicans | 15.7 /100 | #209 | Poor 12.4% |
| Swiss | 14.9 /100 | #210 | Poor 12.4% |
| Immigrants | Bosnia and Herzegovina | 14.8 /100 | #211 | Poor 12.4% |
| Ute | 14.7 /100 | #212 | Poor 12.4% |
| Immigrants | Thailand | 14.5 /100 | #213 | Poor 12.4% |
| Panamanians | 13.5 /100 | #214 | Poor 12.4% |
| Samoans | 13.4 /100 | #215 | Poor 12.4% |
| Immigrants | Burma/Myanmar | 13.3 /100 | #216 | Poor 12.4% |