Yaqui vs Immigrants from North Macedonia Female Disability
COMPARE
Yaqui
Immigrants from North Macedonia
Female Disability
Female Disability Comparison
Yaqui
Immigrants from North Macedonia
13.2%
FEMALE DISABILITY
0.0/ 100
METRIC RATING
287th/ 347
METRIC RANK
11.8%
FEMALE DISABILITY
96.8/ 100
METRIC RATING
122nd/ 347
METRIC RANK
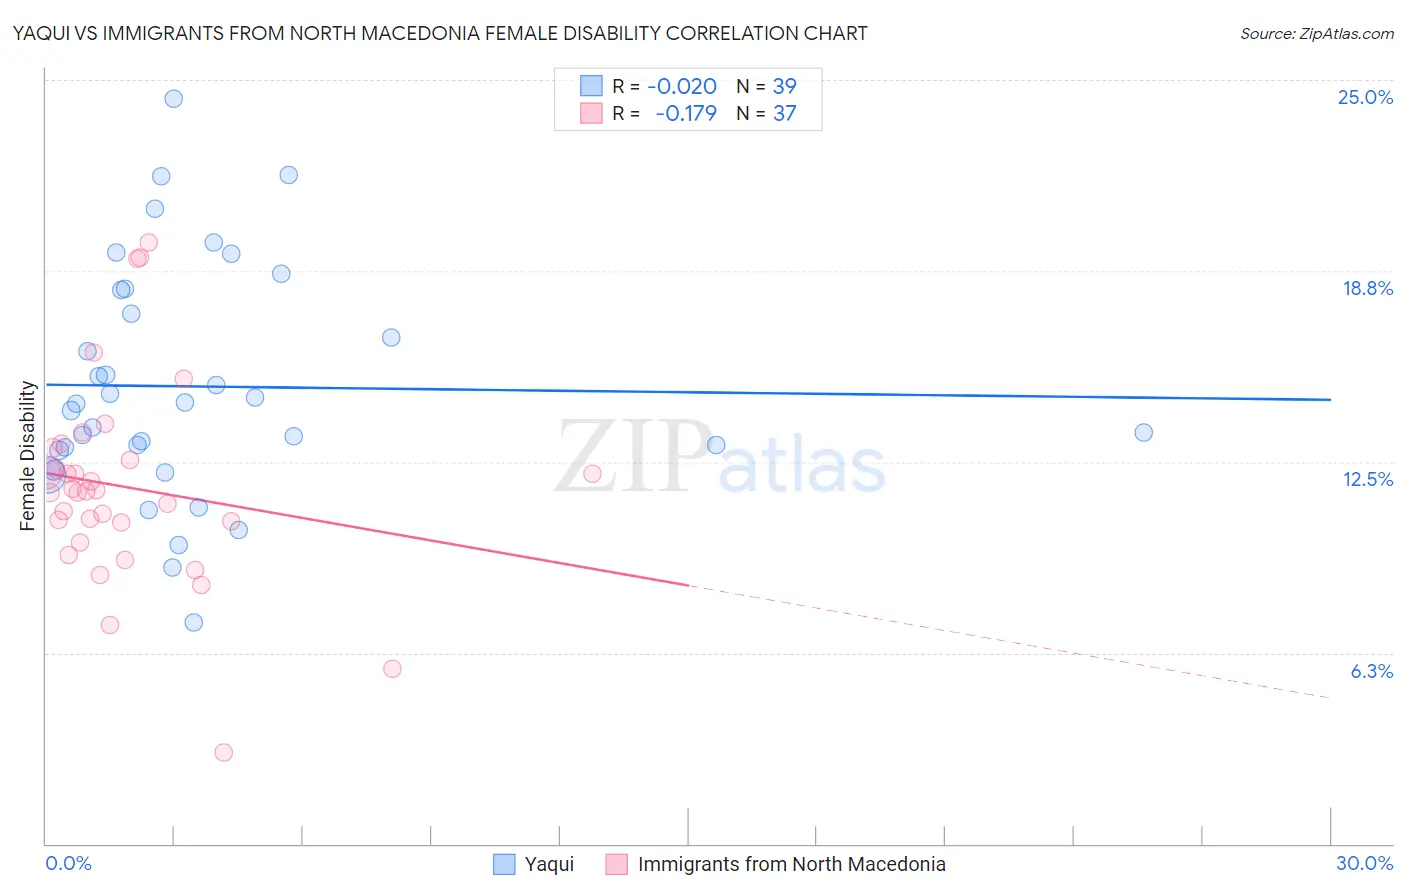
Yaqui vs Immigrants from North Macedonia Female Disability Correlation Chart
The statistical analysis conducted on geographies consisting of 107,719,665 people shows no correlation between the proportion of Yaqui and percentage of females with a disability in the United States with a correlation coefficient (R) of -0.020 and weighted average of 13.2%. Similarly, the statistical analysis conducted on geographies consisting of 74,311,700 people shows a poor negative correlation between the proportion of Immigrants from North Macedonia and percentage of females with a disability in the United States with a correlation coefficient (R) of -0.179 and weighted average of 11.8%, a difference of 11.6%.
Female Disability Correlation Summary
| Measurement | Yaqui | Immigrants from North Macedonia |
| Minimum | 7.2% | 3.0% |
| Maximum | 24.4% | 19.7% |
| Range | 17.1% | 16.7% |
| Mean | 15.0% | 11.7% |
| Median | 14.4% | 11.6% |
| Interquartile 25% (IQ1) | 12.9% | 10.2% |
| Interquartile 75% (IQ3) | 18.1% | 12.8% |
| Interquartile Range (IQR) | 5.2% | 2.6% |
| Standard Deviation (Sample) | 3.8% | 3.3% |
| Standard Deviation (Population) | 3.8% | 3.3% |
Similar Demographics by Female Disability
Demographics Similar to Yaqui by Female Disability
In terms of female disability, the demographic groups most similar to Yaqui are White/Caucasian (13.2%, a difference of 0.10%), Tlingit-Haida (13.2%, a difference of 0.27%), Immigrants from Yemen (13.2%, a difference of 0.27%), Shoshone (13.2%, a difference of 0.34%), and Yakama (13.2%, a difference of 0.50%).
| Demographics | Rating | Rank | Female Disability |
| Irish | 0.1 /100 | #280 | Tragic 13.1% |
| U.S. Virgin Islanders | 0.1 /100 | #281 | Tragic 13.1% |
| Welsh | 0.0 /100 | #282 | Tragic 13.1% |
| English | 0.0 /100 | #283 | Tragic 13.1% |
| Hmong | 0.0 /100 | #284 | Tragic 13.1% |
| Bangladeshis | 0.0 /100 | #285 | Tragic 13.1% |
| Fijians | 0.0 /100 | #286 | Tragic 13.1% |
| Yaqui | 0.0 /100 | #287 | Tragic 13.2% |
| Whites/Caucasians | 0.0 /100 | #288 | Tragic 13.2% |
| Tlingit-Haida | 0.0 /100 | #289 | Tragic 13.2% |
| Immigrants | Yemen | 0.0 /100 | #290 | Tragic 13.2% |
| Shoshone | 0.0 /100 | #291 | Tragic 13.2% |
| Yakama | 0.0 /100 | #292 | Tragic 13.2% |
| Marshallese | 0.0 /100 | #293 | Tragic 13.3% |
| Celtics | 0.0 /100 | #294 | Tragic 13.3% |
Demographics Similar to Immigrants from North Macedonia by Female Disability
In terms of female disability, the demographic groups most similar to Immigrants from North Macedonia are Immigrants from Netherlands (11.8%, a difference of 0.010%), Immigrants from Kazakhstan (11.8%, a difference of 0.040%), Immigrants from Croatia (11.8%, a difference of 0.050%), Russian (11.8%, a difference of 0.10%), and Immigrants from Eastern Europe (11.8%, a difference of 0.12%).
| Demographics | Rating | Rank | Female Disability |
| Brazilians | 97.7 /100 | #115 | Exceptional 11.8% |
| Immigrants | Morocco | 97.6 /100 | #116 | Exceptional 11.8% |
| Immigrants | Eastern Europe | 97.2 /100 | #117 | Exceptional 11.8% |
| Immigrants | Nigeria | 97.2 /100 | #118 | Exceptional 11.8% |
| Immigrants | Uganda | 97.2 /100 | #119 | Exceptional 11.8% |
| Immigrants | Kazakhstan | 97.0 /100 | #120 | Exceptional 11.8% |
| Immigrants | Netherlands | 96.9 /100 | #121 | Exceptional 11.8% |
| Immigrants | North Macedonia | 96.8 /100 | #122 | Exceptional 11.8% |
| Immigrants | Croatia | 96.7 /100 | #123 | Exceptional 11.8% |
| Russians | 96.5 /100 | #124 | Exceptional 11.8% |
| Immigrants | Italy | 96.4 /100 | #125 | Exceptional 11.8% |
| Immigrants | Europe | 96.2 /100 | #126 | Exceptional 11.8% |
| South American Indians | 95.8 /100 | #127 | Exceptional 11.8% |
| Immigrants | Latvia | 95.6 /100 | #128 | Exceptional 11.8% |
| Macedonians | 95.5 /100 | #129 | Exceptional 11.8% |