Immigrants from Cameroon vs Mexican Female Disability
COMPARE
Immigrants from Cameroon
Mexican
Female Disability
Female Disability Comparison
Immigrants from Cameroon
Mexicans
11.6%
FEMALE DISABILITY
99.6/ 100
METRIC RATING
86th/ 347
METRIC RANK
12.4%
FEMALE DISABILITY
15.7/ 100
METRIC RATING
209th/ 347
METRIC RANK
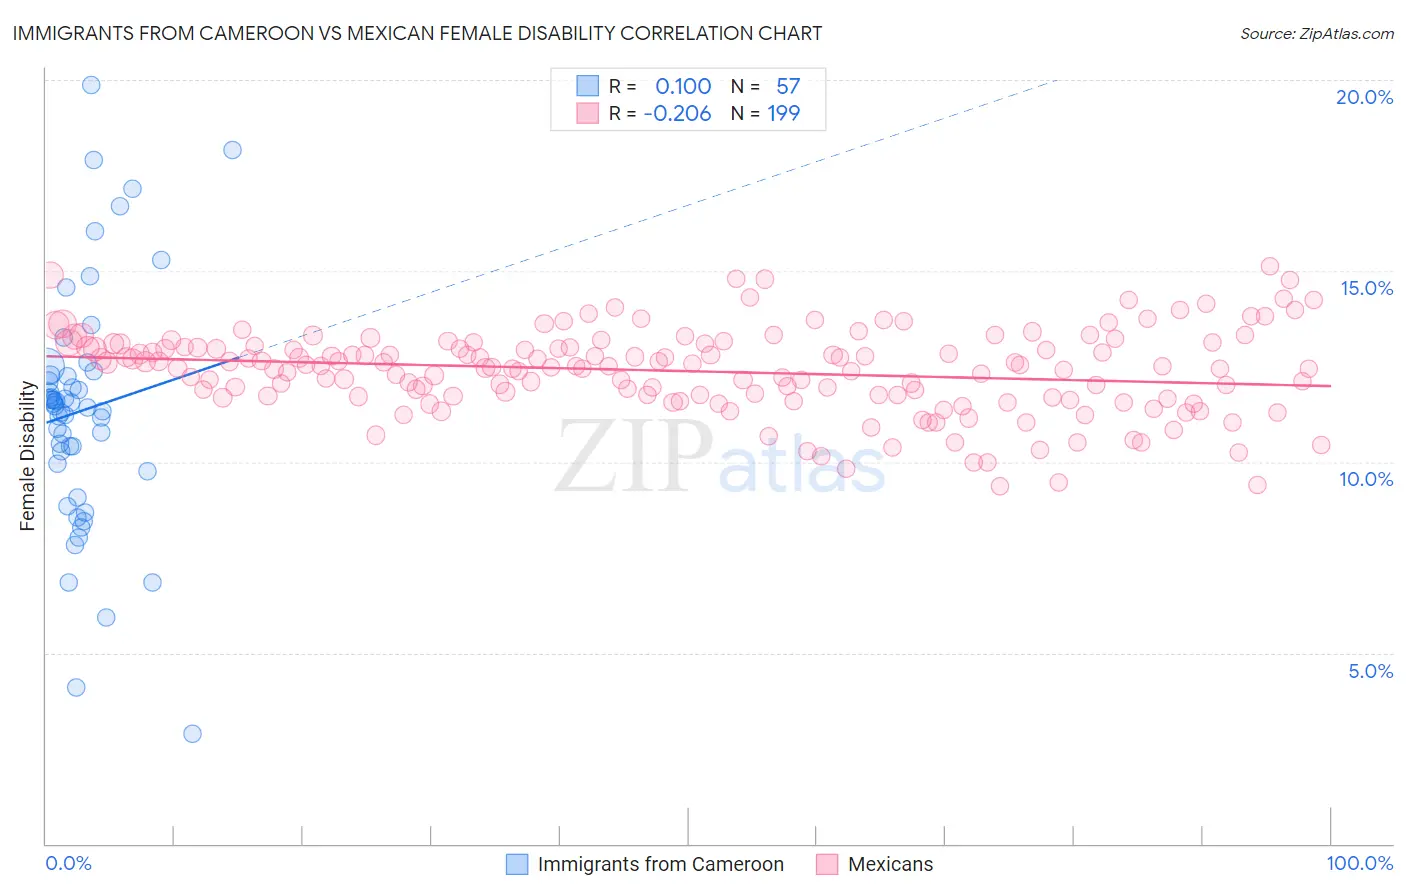
Immigrants from Cameroon vs Mexican Female Disability Correlation Chart
The statistical analysis conducted on geographies consisting of 130,749,562 people shows a poor positive correlation between the proportion of Immigrants from Cameroon and percentage of females with a disability in the United States with a correlation coefficient (R) of 0.100 and weighted average of 11.6%. Similarly, the statistical analysis conducted on geographies consisting of 564,937,802 people shows a weak negative correlation between the proportion of Mexicans and percentage of females with a disability in the United States with a correlation coefficient (R) of -0.206 and weighted average of 12.4%, a difference of 7.1%.
Female Disability Correlation Summary
| Measurement | Immigrants from Cameroon | Mexican |
| Minimum | 2.9% | 9.3% |
| Maximum | 19.9% | 15.1% |
| Range | 17.0% | 5.8% |
| Mean | 11.4% | 12.4% |
| Median | 11.5% | 12.5% |
| Interquartile 25% (IQ1) | 9.9% | 11.7% |
| Interquartile 75% (IQ3) | 12.3% | 13.0% |
| Interquartile Range (IQR) | 2.5% | 1.3% |
| Standard Deviation (Sample) | 3.2% | 1.1% |
| Standard Deviation (Population) | 3.2% | 1.1% |
Similar Demographics by Female Disability
Demographics Similar to Immigrants from Cameroon by Female Disability
In terms of female disability, the demographic groups most similar to Immigrants from Cameroon are Palestinian (11.6%, a difference of 0.0%), Immigrants from Poland (11.6%, a difference of 0.040%), Immigrants from Serbia (11.6%, a difference of 0.070%), Immigrants from Denmark (11.6%, a difference of 0.070%), and Yup'ik (11.6%, a difference of 0.070%).
| Demographics | Rating | Rank | Female Disability |
| Sierra Leoneans | 99.7 /100 | #79 | Exceptional 11.5% |
| Immigrants | Jordan | 99.7 /100 | #80 | Exceptional 11.5% |
| Eastern Europeans | 99.7 /100 | #81 | Exceptional 11.5% |
| Luxembourgers | 99.6 /100 | #82 | Exceptional 11.6% |
| Immigrants | Serbia | 99.6 /100 | #83 | Exceptional 11.6% |
| Immigrants | Poland | 99.6 /100 | #84 | Exceptional 11.6% |
| Palestinians | 99.6 /100 | #85 | Exceptional 11.6% |
| Immigrants | Cameroon | 99.6 /100 | #86 | Exceptional 11.6% |
| Immigrants | Denmark | 99.5 /100 | #87 | Exceptional 11.6% |
| Yup'ik | 99.5 /100 | #88 | Exceptional 11.6% |
| Vietnamese | 99.5 /100 | #89 | Exceptional 11.6% |
| Immigrants | Romania | 99.5 /100 | #90 | Exceptional 11.6% |
| Immigrants | Zimbabwe | 99.5 /100 | #91 | Exceptional 11.6% |
| Immigrants | Czechoslovakia | 99.5 /100 | #92 | Exceptional 11.6% |
| Immigrants | Sierra Leone | 99.4 /100 | #93 | Exceptional 11.6% |
Demographics Similar to Mexicans by Female Disability
In terms of female disability, the demographic groups most similar to Mexicans are Swiss (12.4%, a difference of 0.050%), Immigrants from Bosnia and Herzegovina (12.4%, a difference of 0.060%), Ute (12.4%, a difference of 0.070%), Immigrants from Thailand (12.4%, a difference of 0.090%), and Basque (12.4%, a difference of 0.12%).
| Demographics | Rating | Rank | Female Disability |
| Somalis | 21.5 /100 | #202 | Fair 12.3% |
| Immigrants | Barbados | 21.1 /100 | #203 | Fair 12.3% |
| Immigrants | Zaire | 20.9 /100 | #204 | Fair 12.3% |
| Immigrants | Grenada | 20.5 /100 | #205 | Fair 12.4% |
| Immigrants | Cuba | 20.2 /100 | #206 | Fair 12.4% |
| Croatians | 20.2 /100 | #207 | Fair 12.4% |
| Basques | 17.5 /100 | #208 | Poor 12.4% |
| Mexicans | 15.7 /100 | #209 | Poor 12.4% |
| Swiss | 14.9 /100 | #210 | Poor 12.4% |
| Immigrants | Bosnia and Herzegovina | 14.8 /100 | #211 | Poor 12.4% |
| Ute | 14.7 /100 | #212 | Poor 12.4% |
| Immigrants | Thailand | 14.5 /100 | #213 | Poor 12.4% |
| Panamanians | 13.5 /100 | #214 | Poor 12.4% |
| Samoans | 13.4 /100 | #215 | Poor 12.4% |
| Immigrants | Burma/Myanmar | 13.3 /100 | #216 | Poor 12.4% |