Pennsylvania German vs Mexican Female Disability
COMPARE
Pennsylvania German
Mexican
Female Disability
Female Disability Comparison
Pennsylvania Germans
Mexicans
13.4%
FEMALE DISABILITY
0.0/ 100
METRIC RATING
300th/ 347
METRIC RANK
12.4%
FEMALE DISABILITY
15.7/ 100
METRIC RATING
209th/ 347
METRIC RANK
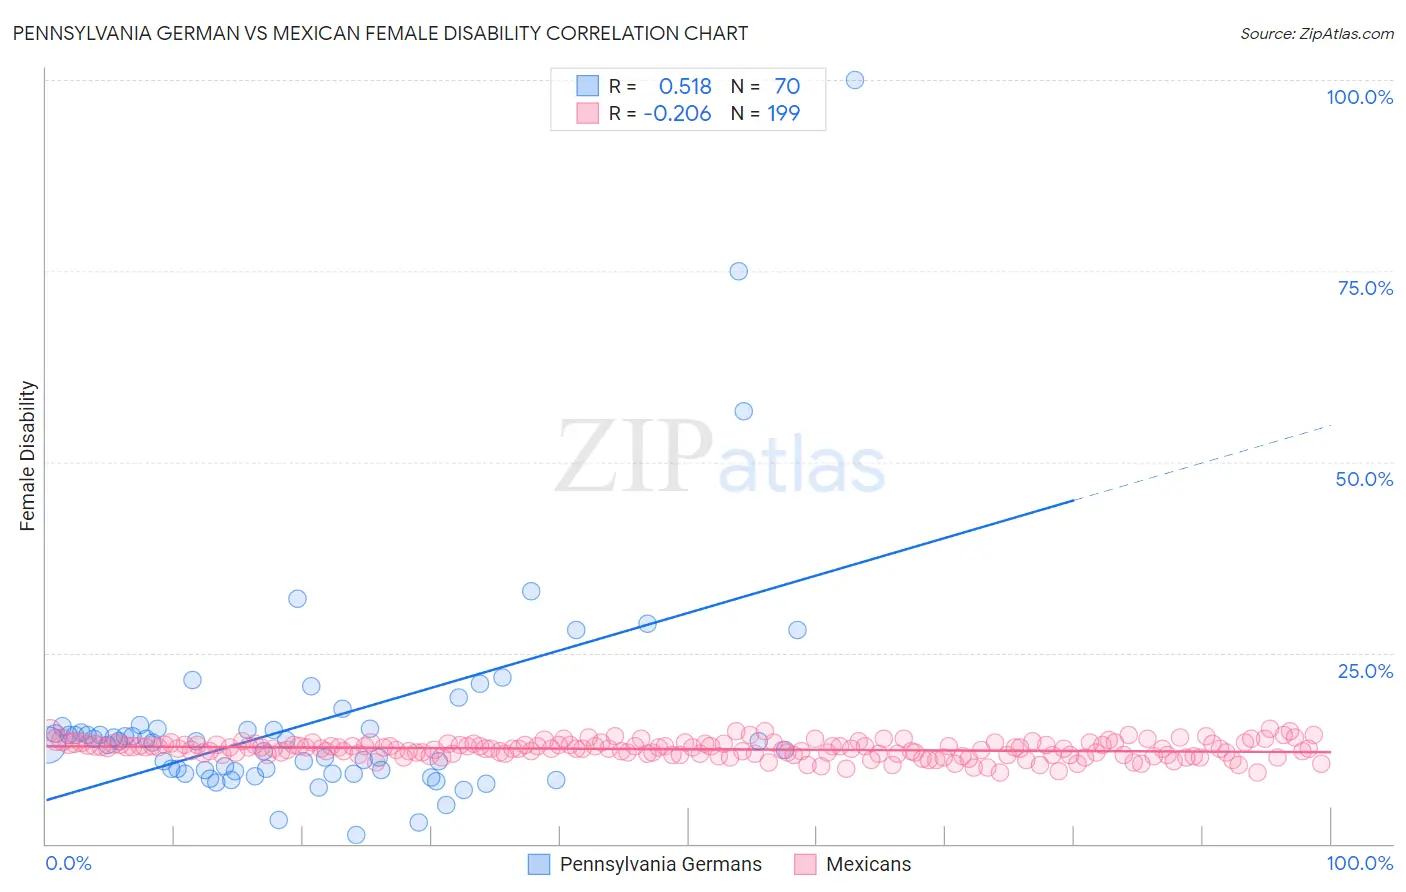
Pennsylvania German vs Mexican Female Disability Correlation Chart
The statistical analysis conducted on geographies consisting of 234,097,367 people shows a substantial positive correlation between the proportion of Pennsylvania Germans and percentage of females with a disability in the United States with a correlation coefficient (R) of 0.518 and weighted average of 13.4%. Similarly, the statistical analysis conducted on geographies consisting of 564,937,802 people shows a weak negative correlation between the proportion of Mexicans and percentage of females with a disability in the United States with a correlation coefficient (R) of -0.206 and weighted average of 12.4%, a difference of 8.2%.
Female Disability Correlation Summary
| Measurement | Pennsylvania German | Mexican |
| Minimum | 1.2% | 9.3% |
| Maximum | 100.0% | 15.1% |
| Range | 98.8% | 5.8% |
| Mean | 16.0% | 12.4% |
| Median | 13.3% | 12.5% |
| Interquartile 25% (IQ1) | 9.4% | 11.7% |
| Interquartile 75% (IQ3) | 15.1% | 13.0% |
| Interquartile Range (IQR) | 5.6% | 1.3% |
| Standard Deviation (Sample) | 14.9% | 1.1% |
| Standard Deviation (Population) | 14.8% | 1.1% |
Similar Demographics by Female Disability
Demographics Similar to Pennsylvania Germans by Female Disability
In terms of female disability, the demographic groups most similar to Pennsylvania Germans are Immigrants from Dominican Republic (13.4%, a difference of 0.010%), African (13.4%, a difference of 0.20%), Nonimmigrants (13.4%, a difference of 0.27%), Scotch-Irish (13.4%, a difference of 0.34%), and Immigrants from Portugal (13.5%, a difference of 0.34%).
| Demographics | Rating | Rank | Female Disability |
| Marshallese | 0.0 /100 | #293 | Tragic 13.3% |
| Celtics | 0.0 /100 | #294 | Tragic 13.3% |
| French | 0.0 /100 | #295 | Tragic 13.3% |
| Nepalese | 0.0 /100 | #296 | Tragic 13.3% |
| Slovaks | 0.0 /100 | #297 | Tragic 13.3% |
| Immigrants | Nonimmigrants | 0.0 /100 | #298 | Tragic 13.4% |
| Immigrants | Dominican Republic | 0.0 /100 | #299 | Tragic 13.4% |
| Pennsylvania Germans | 0.0 /100 | #300 | Tragic 13.4% |
| Africans | 0.0 /100 | #301 | Tragic 13.4% |
| Scotch-Irish | 0.0 /100 | #302 | Tragic 13.4% |
| Immigrants | Portugal | 0.0 /100 | #303 | Tragic 13.5% |
| Immigrants | Micronesia | 0.0 /100 | #304 | Tragic 13.5% |
| Dominicans | 0.0 /100 | #305 | Tragic 13.5% |
| French Canadians | 0.0 /100 | #306 | Tragic 13.6% |
| Central American Indians | 0.0 /100 | #307 | Tragic 13.6% |
Demographics Similar to Mexicans by Female Disability
In terms of female disability, the demographic groups most similar to Mexicans are Swiss (12.4%, a difference of 0.050%), Immigrants from Bosnia and Herzegovina (12.4%, a difference of 0.060%), Ute (12.4%, a difference of 0.070%), Immigrants from Thailand (12.4%, a difference of 0.090%), and Basque (12.4%, a difference of 0.12%).
| Demographics | Rating | Rank | Female Disability |
| Somalis | 21.5 /100 | #202 | Fair 12.3% |
| Immigrants | Barbados | 21.1 /100 | #203 | Fair 12.3% |
| Immigrants | Zaire | 20.9 /100 | #204 | Fair 12.3% |
| Immigrants | Grenada | 20.5 /100 | #205 | Fair 12.4% |
| Immigrants | Cuba | 20.2 /100 | #206 | Fair 12.4% |
| Croatians | 20.2 /100 | #207 | Fair 12.4% |
| Basques | 17.5 /100 | #208 | Poor 12.4% |
| Mexicans | 15.7 /100 | #209 | Poor 12.4% |
| Swiss | 14.9 /100 | #210 | Poor 12.4% |
| Immigrants | Bosnia and Herzegovina | 14.8 /100 | #211 | Poor 12.4% |
| Ute | 14.7 /100 | #212 | Poor 12.4% |
| Immigrants | Thailand | 14.5 /100 | #213 | Poor 12.4% |
| Panamanians | 13.5 /100 | #214 | Poor 12.4% |
| Samoans | 13.4 /100 | #215 | Poor 12.4% |
| Immigrants | Burma/Myanmar | 13.3 /100 | #216 | Poor 12.4% |