Yaqui vs Senegalese Female Disability
COMPARE
Yaqui
Senegalese
Female Disability
Female Disability Comparison
Yaqui
Senegalese
13.2%
FEMALE DISABILITY
0.0/ 100
METRIC RATING
287th/ 347
METRIC RANK
12.8%
FEMALE DISABILITY
0.4/ 100
METRIC RATING
267th/ 347
METRIC RANK
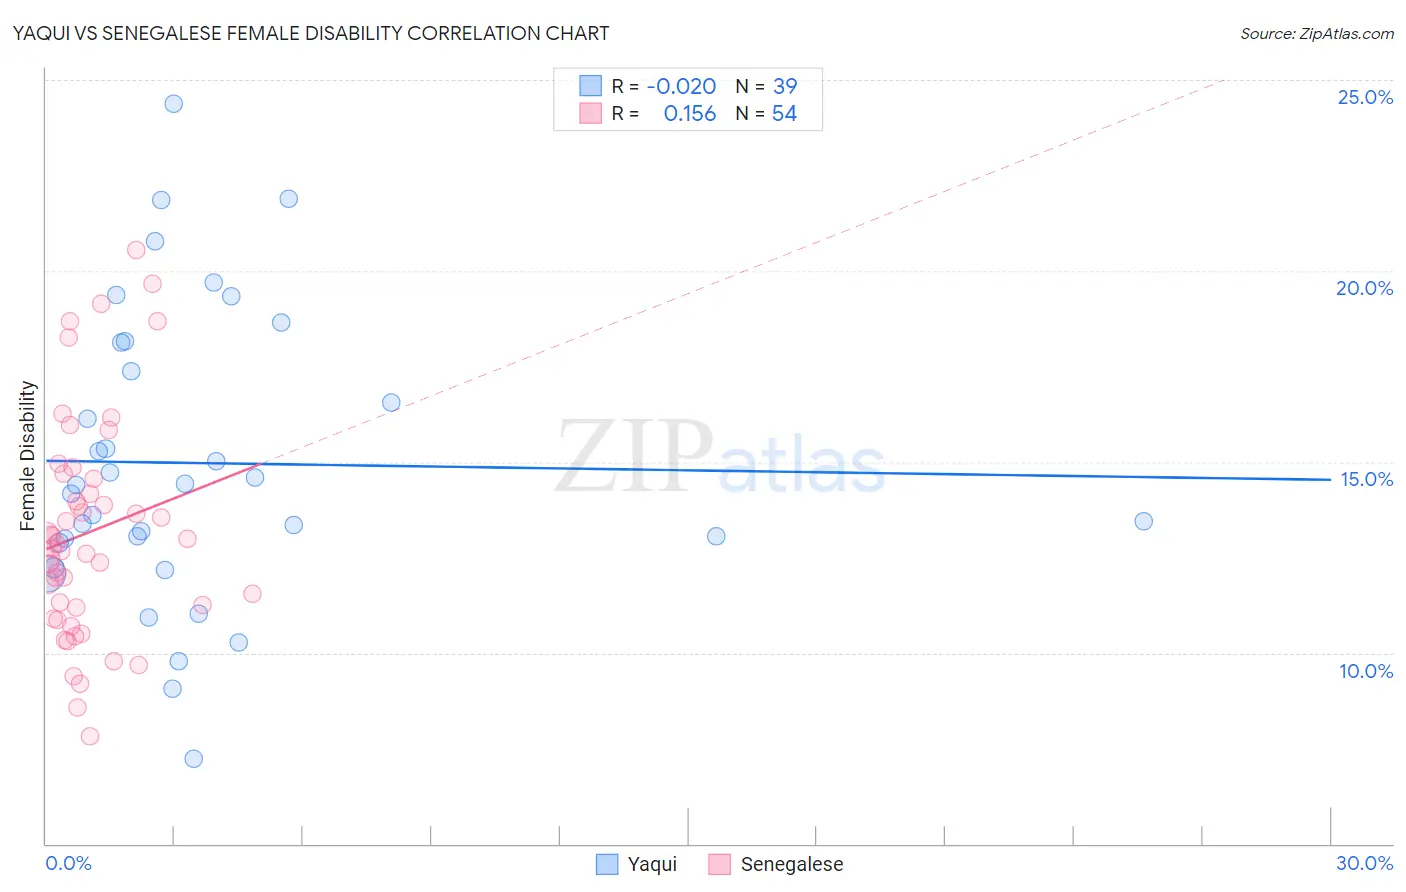
Yaqui vs Senegalese Female Disability Correlation Chart
The statistical analysis conducted on geographies consisting of 107,719,665 people shows no correlation between the proportion of Yaqui and percentage of females with a disability in the United States with a correlation coefficient (R) of -0.020 and weighted average of 13.2%. Similarly, the statistical analysis conducted on geographies consisting of 78,142,569 people shows a poor positive correlation between the proportion of Senegalese and percentage of females with a disability in the United States with a correlation coefficient (R) of 0.156 and weighted average of 12.8%, a difference of 2.7%.
Female Disability Correlation Summary
| Measurement | Yaqui | Senegalese |
| Minimum | 7.2% | 7.8% |
| Maximum | 24.4% | 20.6% |
| Range | 17.1% | 12.7% |
| Mean | 15.0% | 13.2% |
| Median | 14.4% | 12.8% |
| Interquartile 25% (IQ1) | 12.9% | 11.2% |
| Interquartile 75% (IQ3) | 18.1% | 14.5% |
| Interquartile Range (IQR) | 5.2% | 3.4% |
| Standard Deviation (Sample) | 3.8% | 2.9% |
| Standard Deviation (Population) | 3.8% | 2.9% |
Demographics Similar to Yaqui and Senegalese by Female Disability
In terms of female disability, the demographic groups most similar to Yaqui are Fijian (13.1%, a difference of 0.53%), Bangladeshi (13.1%, a difference of 0.58%), Hmong (13.1%, a difference of 0.63%), English (13.1%, a difference of 0.76%), and Welsh (13.1%, a difference of 0.77%). Similarly, the demographic groups most similar to Senegalese are Immigrants from Laos (12.8%, a difference of 0.030%), Indonesian (12.8%, a difference of 0.090%), Immigrants from Liberia (12.9%, a difference of 0.27%), Dutch (12.9%, a difference of 0.75%), and German (12.9%, a difference of 0.97%).
| Demographics | Rating | Rank | Female Disability |
| Senegalese | 0.4 /100 | #267 | Tragic 12.8% |
| Immigrants | Laos | 0.4 /100 | #268 | Tragic 12.8% |
| Indonesians | 0.4 /100 | #269 | Tragic 12.8% |
| Immigrants | Liberia | 0.3 /100 | #270 | Tragic 12.9% |
| Dutch | 0.2 /100 | #271 | Tragic 12.9% |
| Germans | 0.1 /100 | #272 | Tragic 12.9% |
| Sioux | 0.1 /100 | #273 | Tragic 12.9% |
| Portuguese | 0.1 /100 | #274 | Tragic 13.0% |
| Cheyenne | 0.1 /100 | #275 | Tragic 13.0% |
| Immigrants | Dominica | 0.1 /100 | #276 | Tragic 13.0% |
| Spanish | 0.1 /100 | #277 | Tragic 13.0% |
| Scottish | 0.1 /100 | #278 | Tragic 13.0% |
| Arapaho | 0.1 /100 | #279 | Tragic 13.0% |
| Irish | 0.1 /100 | #280 | Tragic 13.1% |
| U.S. Virgin Islanders | 0.1 /100 | #281 | Tragic 13.1% |
| Welsh | 0.0 /100 | #282 | Tragic 13.1% |
| English | 0.0 /100 | #283 | Tragic 13.1% |
| Hmong | 0.0 /100 | #284 | Tragic 13.1% |
| Bangladeshis | 0.0 /100 | #285 | Tragic 13.1% |
| Fijians | 0.0 /100 | #286 | Tragic 13.1% |
| Yaqui | 0.0 /100 | #287 | Tragic 13.2% |