Yaqui vs Lebanese Female Disability
COMPARE
Yaqui
Lebanese
Female Disability
Female Disability Comparison
Yaqui
Lebanese
13.2%
FEMALE DISABILITY
0.0/ 100
METRIC RATING
287th/ 347
METRIC RANK
12.2%
FEMALE DISABILITY
58.1/ 100
METRIC RATING
169th/ 347
METRIC RANK
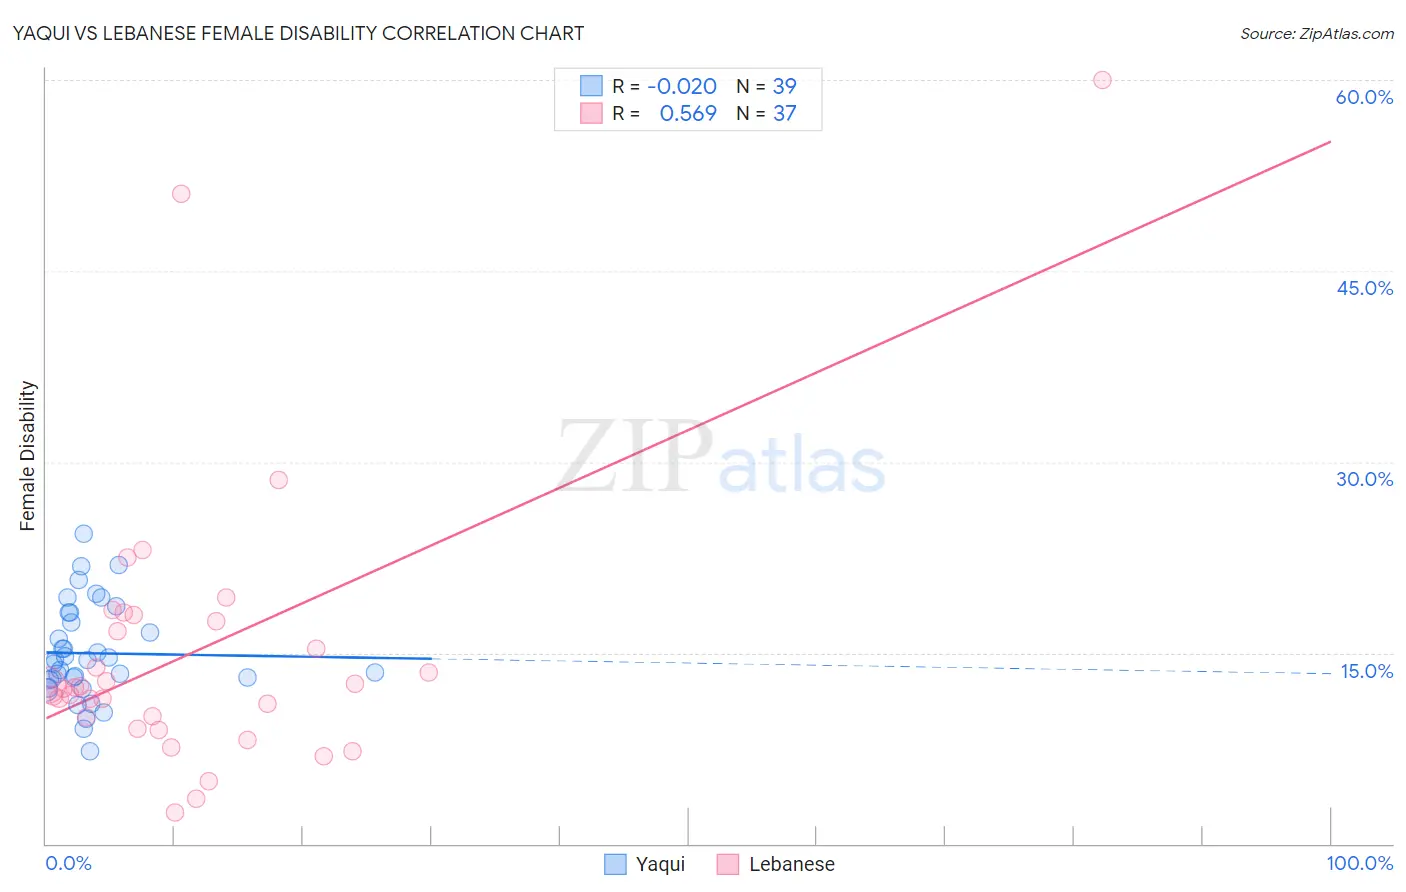
Yaqui vs Lebanese Female Disability Correlation Chart
The statistical analysis conducted on geographies consisting of 107,719,665 people shows no correlation between the proportion of Yaqui and percentage of females with a disability in the United States with a correlation coefficient (R) of -0.020 and weighted average of 13.2%. Similarly, the statistical analysis conducted on geographies consisting of 401,580,579 people shows a substantial positive correlation between the proportion of Lebanese and percentage of females with a disability in the United States with a correlation coefficient (R) of 0.569 and weighted average of 12.2%, a difference of 8.3%.
Female Disability Correlation Summary
| Measurement | Yaqui | Lebanese |
| Minimum | 7.2% | 2.4% |
| Maximum | 24.4% | 60.0% |
| Range | 17.1% | 57.6% |
| Mean | 15.0% | 15.1% |
| Median | 14.4% | 12.3% |
| Interquartile 25% (IQ1) | 12.9% | 9.5% |
| Interquartile 75% (IQ3) | 18.1% | 17.8% |
| Interquartile Range (IQR) | 5.2% | 8.3% |
| Standard Deviation (Sample) | 3.8% | 11.2% |
| Standard Deviation (Population) | 3.8% | 11.1% |
Similar Demographics by Female Disability
Demographics Similar to Yaqui by Female Disability
In terms of female disability, the demographic groups most similar to Yaqui are White/Caucasian (13.2%, a difference of 0.10%), Tlingit-Haida (13.2%, a difference of 0.27%), Immigrants from Yemen (13.2%, a difference of 0.27%), Shoshone (13.2%, a difference of 0.34%), and Yakama (13.2%, a difference of 0.50%).
| Demographics | Rating | Rank | Female Disability |
| Irish | 0.1 /100 | #280 | Tragic 13.1% |
| U.S. Virgin Islanders | 0.1 /100 | #281 | Tragic 13.1% |
| Welsh | 0.0 /100 | #282 | Tragic 13.1% |
| English | 0.0 /100 | #283 | Tragic 13.1% |
| Hmong | 0.0 /100 | #284 | Tragic 13.1% |
| Bangladeshis | 0.0 /100 | #285 | Tragic 13.1% |
| Fijians | 0.0 /100 | #286 | Tragic 13.1% |
| Yaqui | 0.0 /100 | #287 | Tragic 13.2% |
| Whites/Caucasians | 0.0 /100 | #288 | Tragic 13.2% |
| Tlingit-Haida | 0.0 /100 | #289 | Tragic 13.2% |
| Immigrants | Yemen | 0.0 /100 | #290 | Tragic 13.2% |
| Shoshone | 0.0 /100 | #291 | Tragic 13.2% |
| Yakama | 0.0 /100 | #292 | Tragic 13.2% |
| Marshallese | 0.0 /100 | #293 | Tragic 13.3% |
| Celtics | 0.0 /100 | #294 | Tragic 13.3% |
Demographics Similar to Lebanese by Female Disability
In terms of female disability, the demographic groups most similar to Lebanese are Immigrants from Haiti (12.2%, a difference of 0.030%), Immigrants from Latin America (12.2%, a difference of 0.040%), Maltese (12.2%, a difference of 0.040%), Lithuanian (12.2%, a difference of 0.050%), and Immigrants from Southern Europe (12.2%, a difference of 0.070%).
| Demographics | Rating | Rank | Female Disability |
| Immigrants | Ukraine | 64.3 /100 | #162 | Good 12.1% |
| Guatemalans | 63.8 /100 | #163 | Good 12.1% |
| Czechs | 63.6 /100 | #164 | Good 12.1% |
| Immigrants | Oceania | 61.8 /100 | #165 | Good 12.1% |
| Lithuanians | 59.5 /100 | #166 | Average 12.2% |
| Immigrants | Latin America | 59.0 /100 | #167 | Average 12.2% |
| Immigrants | Haiti | 58.8 /100 | #168 | Average 12.2% |
| Lebanese | 58.1 /100 | #169 | Average 12.2% |
| Maltese | 57.0 /100 | #170 | Average 12.2% |
| Immigrants | Southern Europe | 56.3 /100 | #171 | Average 12.2% |
| Haitians | 51.9 /100 | #172 | Average 12.2% |
| Immigrants | Mexico | 50.8 /100 | #173 | Average 12.2% |
| Immigrants | England | 50.0 /100 | #174 | Average 12.2% |
| Immigrants | St. Vincent and the Grenadines | 49.7 /100 | #175 | Average 12.2% |
| Immigrants | Guyana | 43.1 /100 | #176 | Average 12.2% |