Yaqui vs Immigrants from Hungary Female Disability
COMPARE
Yaqui
Immigrants from Hungary
Female Disability
Female Disability Comparison
Yaqui
Immigrants from Hungary
13.2%
FEMALE DISABILITY
0.0/ 100
METRIC RATING
287th/ 347
METRIC RANK
11.9%
FEMALE DISABILITY
92.8/ 100
METRIC RATING
139th/ 347
METRIC RANK
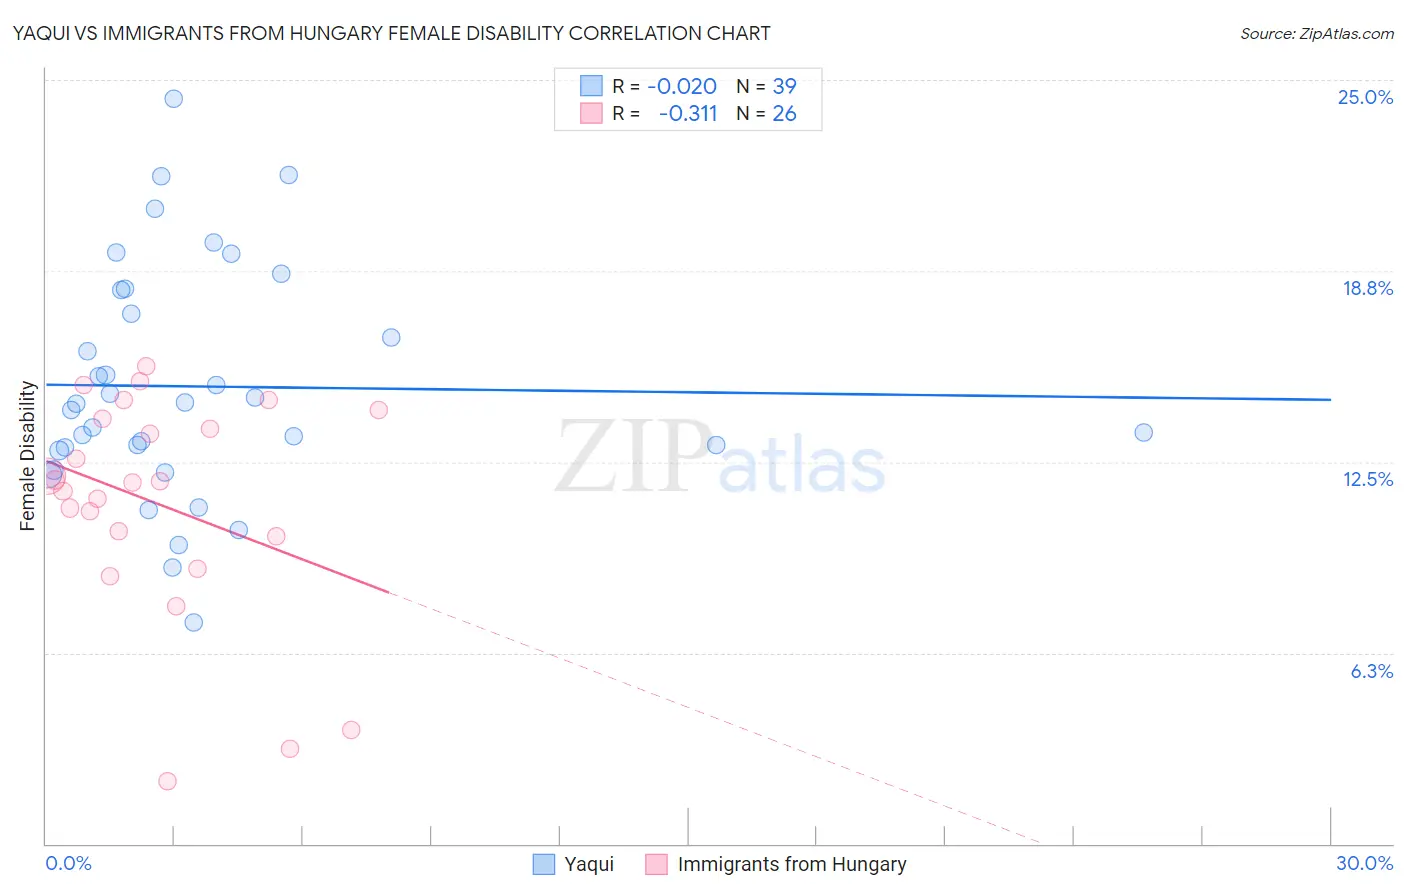
Yaqui vs Immigrants from Hungary Female Disability Correlation Chart
The statistical analysis conducted on geographies consisting of 107,719,665 people shows no correlation between the proportion of Yaqui and percentage of females with a disability in the United States with a correlation coefficient (R) of -0.020 and weighted average of 13.2%. Similarly, the statistical analysis conducted on geographies consisting of 195,708,116 people shows a mild negative correlation between the proportion of Immigrants from Hungary and percentage of females with a disability in the United States with a correlation coefficient (R) of -0.311 and weighted average of 11.9%, a difference of 10.7%.
Female Disability Correlation Summary
| Measurement | Yaqui | Immigrants from Hungary |
| Minimum | 7.2% | 2.0% |
| Maximum | 24.4% | 15.6% |
| Range | 17.1% | 13.6% |
| Mean | 15.0% | 11.1% |
| Median | 14.4% | 11.8% |
| Interquartile 25% (IQ1) | 12.9% | 10.1% |
| Interquartile 75% (IQ3) | 18.1% | 13.9% |
| Interquartile Range (IQR) | 5.2% | 3.8% |
| Standard Deviation (Sample) | 3.8% | 3.6% |
| Standard Deviation (Population) | 3.8% | 3.6% |
Similar Demographics by Female Disability
Demographics Similar to Yaqui by Female Disability
In terms of female disability, the demographic groups most similar to Yaqui are White/Caucasian (13.2%, a difference of 0.10%), Tlingit-Haida (13.2%, a difference of 0.27%), Immigrants from Yemen (13.2%, a difference of 0.27%), Shoshone (13.2%, a difference of 0.34%), and Yakama (13.2%, a difference of 0.50%).
| Demographics | Rating | Rank | Female Disability |
| Irish | 0.1 /100 | #280 | Tragic 13.1% |
| U.S. Virgin Islanders | 0.1 /100 | #281 | Tragic 13.1% |
| Welsh | 0.0 /100 | #282 | Tragic 13.1% |
| English | 0.0 /100 | #283 | Tragic 13.1% |
| Hmong | 0.0 /100 | #284 | Tragic 13.1% |
| Bangladeshis | 0.0 /100 | #285 | Tragic 13.1% |
| Fijians | 0.0 /100 | #286 | Tragic 13.1% |
| Yaqui | 0.0 /100 | #287 | Tragic 13.2% |
| Whites/Caucasians | 0.0 /100 | #288 | Tragic 13.2% |
| Tlingit-Haida | 0.0 /100 | #289 | Tragic 13.2% |
| Immigrants | Yemen | 0.0 /100 | #290 | Tragic 13.2% |
| Shoshone | 0.0 /100 | #291 | Tragic 13.2% |
| Yakama | 0.0 /100 | #292 | Tragic 13.2% |
| Marshallese | 0.0 /100 | #293 | Tragic 13.3% |
| Celtics | 0.0 /100 | #294 | Tragic 13.3% |
Demographics Similar to Immigrants from Hungary by Female Disability
In terms of female disability, the demographic groups most similar to Immigrants from Hungary are Ecuadorian (11.9%, a difference of 0.090%), Immigrants from Norway (11.9%, a difference of 0.15%), Romanian (11.9%, a difference of 0.16%), Immigrants from Ecuador (11.9%, a difference of 0.18%), and Ugandan (11.9%, a difference of 0.19%).
| Demographics | Rating | Rank | Female Disability |
| Immigrants | Syria | 94.6 /100 | #132 | Exceptional 11.9% |
| Kenyans | 94.5 /100 | #133 | Exceptional 11.9% |
| Immigrants | Nicaragua | 94.5 /100 | #134 | Exceptional 11.9% |
| Central Americans | 94.2 /100 | #135 | Exceptional 11.9% |
| Ugandans | 94.0 /100 | #136 | Exceptional 11.9% |
| Immigrants | Norway | 93.8 /100 | #137 | Exceptional 11.9% |
| Ecuadorians | 93.4 /100 | #138 | Exceptional 11.9% |
| Immigrants | Hungary | 92.8 /100 | #139 | Exceptional 11.9% |
| Romanians | 91.6 /100 | #140 | Exceptional 11.9% |
| Immigrants | Ecuador | 91.5 /100 | #141 | Exceptional 11.9% |
| Immigrants | Africa | 90.0 /100 | #142 | Excellent 11.9% |
| Immigrants | Sudan | 89.6 /100 | #143 | Excellent 11.9% |
| Immigrants | Austria | 87.9 /100 | #144 | Excellent 12.0% |
| Estonians | 87.8 /100 | #145 | Excellent 12.0% |
| Pakistanis | 84.6 /100 | #146 | Excellent 12.0% |