Immigrants from Western Asia vs Mexican Female Disability
COMPARE
Immigrants from Western Asia
Mexican
Female Disability
Female Disability Comparison
Immigrants from Western Asia
Mexicans
11.7%
FEMALE DISABILITY
98.3/ 100
METRIC RATING
104th/ 347
METRIC RANK
12.4%
FEMALE DISABILITY
15.7/ 100
METRIC RATING
209th/ 347
METRIC RANK
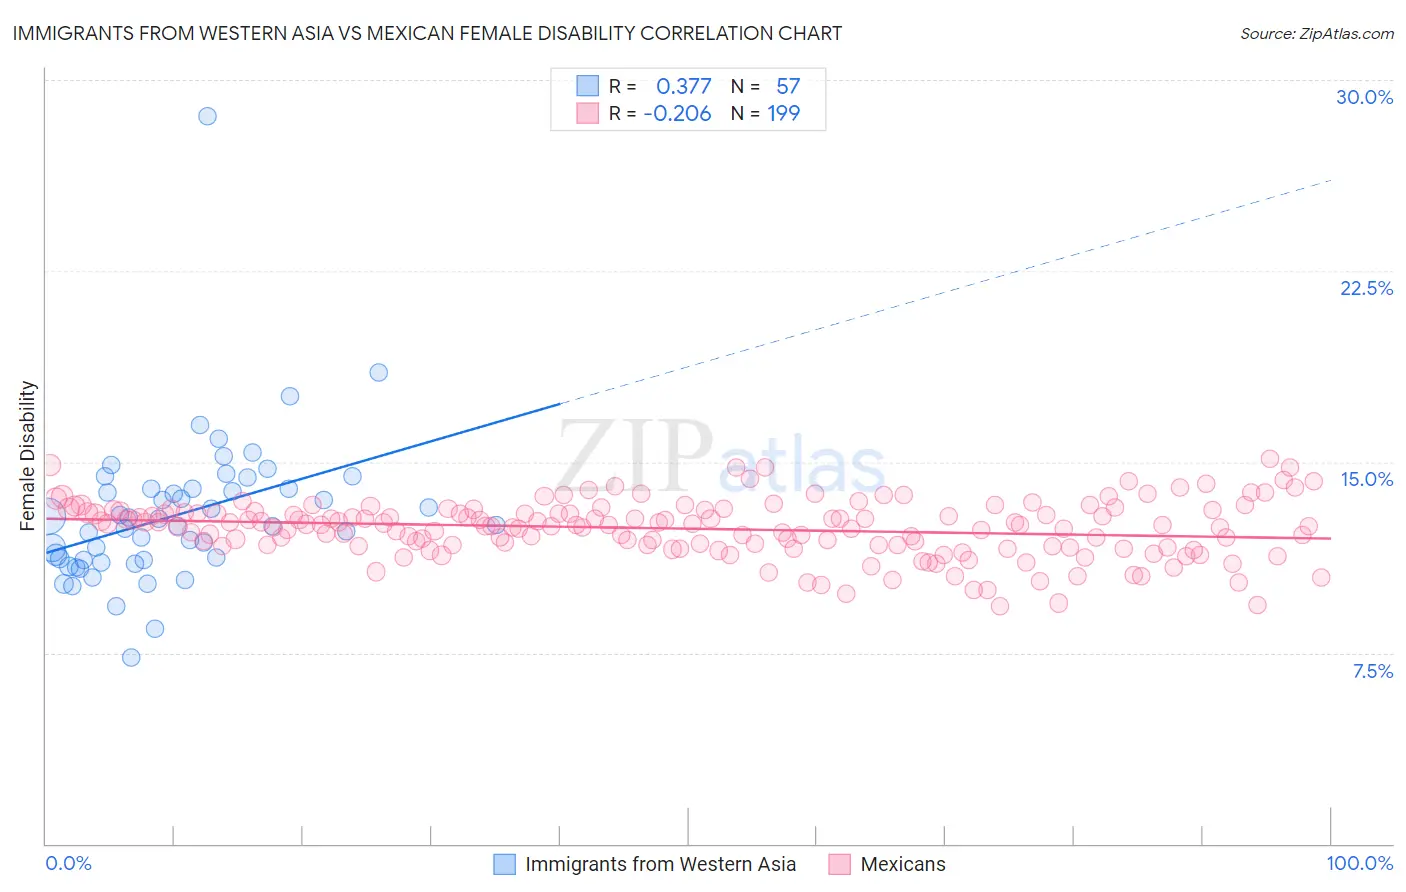
Immigrants from Western Asia vs Mexican Female Disability Correlation Chart
The statistical analysis conducted on geographies consisting of 404,394,576 people shows a mild positive correlation between the proportion of Immigrants from Western Asia and percentage of females with a disability in the United States with a correlation coefficient (R) of 0.377 and weighted average of 11.7%. Similarly, the statistical analysis conducted on geographies consisting of 564,937,802 people shows a weak negative correlation between the proportion of Mexicans and percentage of females with a disability in the United States with a correlation coefficient (R) of -0.206 and weighted average of 12.4%, a difference of 5.6%.
Female Disability Correlation Summary
| Measurement | Immigrants from Western Asia | Mexican |
| Minimum | 7.3% | 9.3% |
| Maximum | 28.6% | 15.1% |
| Range | 21.3% | 5.8% |
| Mean | 12.9% | 12.4% |
| Median | 12.5% | 12.5% |
| Interquartile 25% (IQ1) | 11.1% | 11.7% |
| Interquartile 75% (IQ3) | 14.0% | 13.0% |
| Interquartile Range (IQR) | 2.8% | 1.3% |
| Standard Deviation (Sample) | 3.0% | 1.1% |
| Standard Deviation (Population) | 2.9% | 1.1% |
Similar Demographics by Female Disability
Demographics Similar to Immigrants from Western Asia by Female Disability
In terms of female disability, the demographic groups most similar to Immigrants from Western Asia are Immigrants from Eastern Africa (11.7%, a difference of 0.010%), Australian (11.7%, a difference of 0.020%), Immigrants from Greece (11.7%, a difference of 0.040%), Latvian (11.7%, a difference of 0.070%), and Immigrants from South Eastern Asia (11.7%, a difference of 0.080%).
| Demographics | Rating | Rank | Female Disability |
| Koreans | 99.0 /100 | #97 | Exceptional 11.7% |
| Uruguayans | 98.8 /100 | #98 | Exceptional 11.7% |
| Immigrants | Philippines | 98.6 /100 | #99 | Exceptional 11.7% |
| Immigrants | Uruguay | 98.5 /100 | #100 | Exceptional 11.7% |
| Immigrants | Costa Rica | 98.4 /100 | #101 | Exceptional 11.7% |
| Immigrants | South Eastern Asia | 98.4 /100 | #102 | Exceptional 11.7% |
| Immigrants | Eastern Africa | 98.3 /100 | #103 | Exceptional 11.7% |
| Immigrants | Western Asia | 98.3 /100 | #104 | Exceptional 11.7% |
| Australians | 98.3 /100 | #105 | Exceptional 11.7% |
| Immigrants | Greece | 98.2 /100 | #106 | Exceptional 11.7% |
| Latvians | 98.2 /100 | #107 | Exceptional 11.7% |
| New Zealanders | 98.1 /100 | #108 | Exceptional 11.7% |
| Immigrants | Immigrants | 98.1 /100 | #109 | Exceptional 11.7% |
| Soviet Union | 98.1 /100 | #110 | Exceptional 11.7% |
| Costa Ricans | 98.1 /100 | #111 | Exceptional 11.7% |
Demographics Similar to Mexicans by Female Disability
In terms of female disability, the demographic groups most similar to Mexicans are Swiss (12.4%, a difference of 0.050%), Immigrants from Bosnia and Herzegovina (12.4%, a difference of 0.060%), Ute (12.4%, a difference of 0.070%), Immigrants from Thailand (12.4%, a difference of 0.090%), and Basque (12.4%, a difference of 0.12%).
| Demographics | Rating | Rank | Female Disability |
| Somalis | 21.5 /100 | #202 | Fair 12.3% |
| Immigrants | Barbados | 21.1 /100 | #203 | Fair 12.3% |
| Immigrants | Zaire | 20.9 /100 | #204 | Fair 12.3% |
| Immigrants | Grenada | 20.5 /100 | #205 | Fair 12.4% |
| Immigrants | Cuba | 20.2 /100 | #206 | Fair 12.4% |
| Croatians | 20.2 /100 | #207 | Fair 12.4% |
| Basques | 17.5 /100 | #208 | Poor 12.4% |
| Mexicans | 15.7 /100 | #209 | Poor 12.4% |
| Swiss | 14.9 /100 | #210 | Poor 12.4% |
| Immigrants | Bosnia and Herzegovina | 14.8 /100 | #211 | Poor 12.4% |
| Ute | 14.7 /100 | #212 | Poor 12.4% |
| Immigrants | Thailand | 14.5 /100 | #213 | Poor 12.4% |
| Panamanians | 13.5 /100 | #214 | Poor 12.4% |
| Samoans | 13.4 /100 | #215 | Poor 12.4% |
| Immigrants | Burma/Myanmar | 13.3 /100 | #216 | Poor 12.4% |