Yaqui vs Mexican Median Earnings
COMPARE
Yaqui
Mexican
Median Earnings
Median Earnings Comparison
Yaqui
Mexicans
$40,647
MEDIAN EARNINGS
0.0/ 100
METRIC RATING
306th/ 347
METRIC RANK
$39,834
MEDIAN EARNINGS
0.0/ 100
METRIC RATING
321st/ 347
METRIC RANK
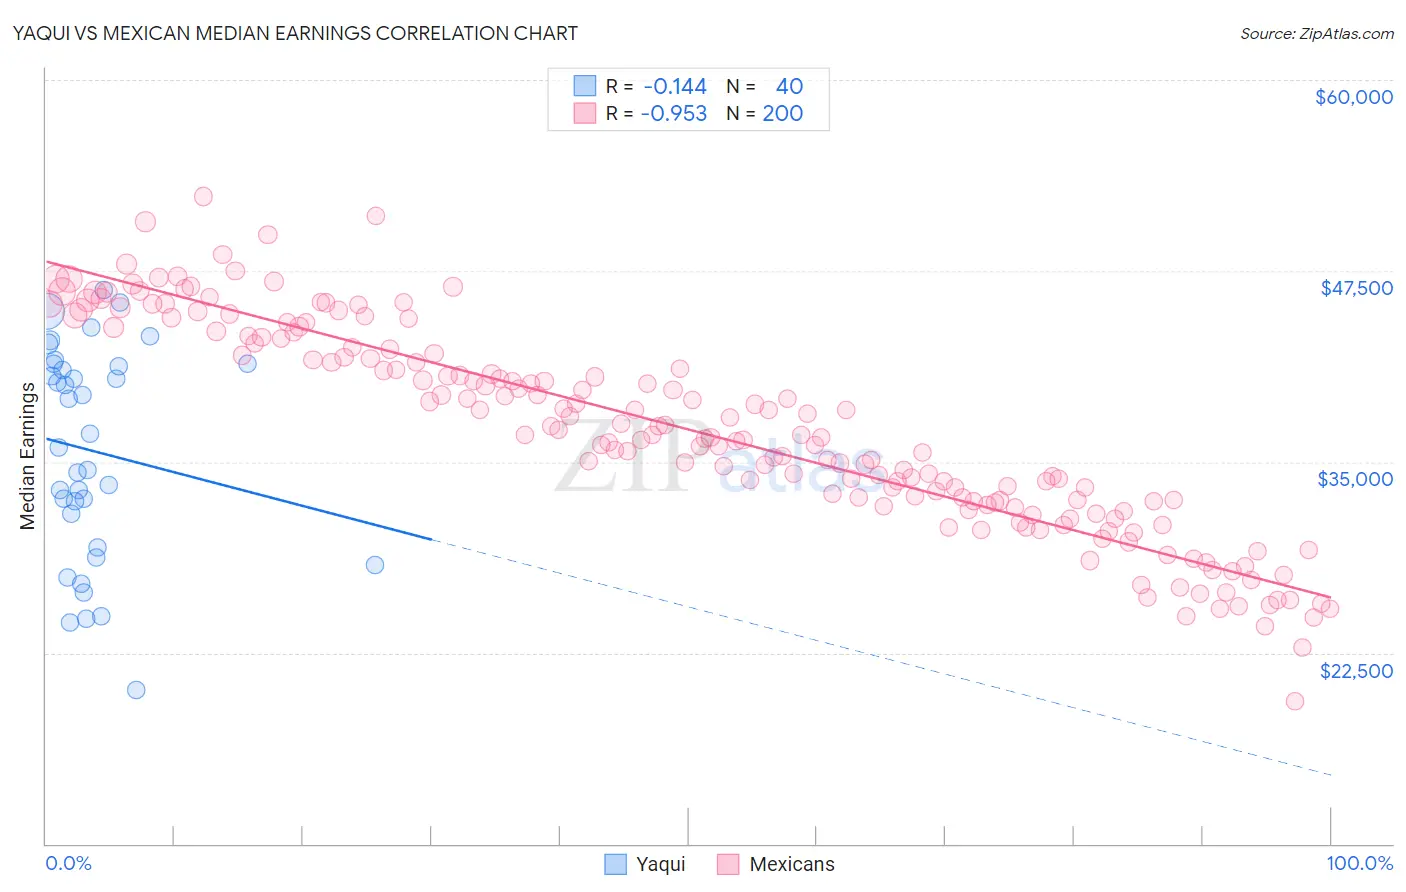
Yaqui vs Mexican Median Earnings Correlation Chart
The statistical analysis conducted on geographies consisting of 107,736,593 people shows a poor negative correlation between the proportion of Yaqui and median earnings in the United States with a correlation coefficient (R) of -0.144 and weighted average of $40,647. Similarly, the statistical analysis conducted on geographies consisting of 564,951,151 people shows a perfect negative correlation between the proportion of Mexicans and median earnings in the United States with a correlation coefficient (R) of -0.953 and weighted average of $39,834, a difference of 2.0%.
Median Earnings Correlation Summary
| Measurement | Yaqui | Mexican |
| Minimum | $20,058 | $19,356 |
| Maximum | $46,273 | $52,379 |
| Range | $26,215 | $33,023 |
| Mean | $35,713 | $37,116 |
| Median | $36,396 | $36,764 |
| Interquartile 25% (IQ1) | $30,515 | $32,451 |
| Interquartile 75% (IQ3) | $41,344 | $42,421 |
| Interquartile Range (IQR) | $10,829 | $9,971 |
| Standard Deviation (Sample) | $6,900 | $6,683 |
| Standard Deviation (Population) | $6,813 | $6,666 |
Demographics Similar to Yaqui and Mexicans by Median Earnings
In terms of median earnings, the demographic groups most similar to Yaqui are Honduran ($40,638, a difference of 0.020%), Chickasaw ($40,672, a difference of 0.060%), Cuban ($40,619, a difference of 0.070%), Immigrants from Haiti ($40,550, a difference of 0.24%), and Immigrants from Guatemala ($40,851, a difference of 0.50%). Similarly, the demographic groups most similar to Mexicans are Immigrants from Bahamas ($39,861, a difference of 0.070%), Immigrants from Central America ($39,762, a difference of 0.18%), Bahamian ($39,735, a difference of 0.25%), Black/African American ($40,085, a difference of 0.63%), and Dutch West Indian ($40,107, a difference of 0.69%).
| Demographics | Rating | Rank | Median Earnings |
| Haitians | 0.0 /100 | #303 | Tragic $40,918 |
| Immigrants | Guatemala | 0.0 /100 | #304 | Tragic $40,851 |
| Chickasaw | 0.0 /100 | #305 | Tragic $40,672 |
| Yaqui | 0.0 /100 | #306 | Tragic $40,647 |
| Hondurans | 0.0 /100 | #307 | Tragic $40,638 |
| Cubans | 0.0 /100 | #308 | Tragic $40,619 |
| Immigrants | Haiti | 0.0 /100 | #309 | Tragic $40,550 |
| Apache | 0.0 /100 | #310 | Tragic $40,388 |
| Hispanics or Latinos | 0.0 /100 | #311 | Tragic $40,288 |
| Chippewa | 0.0 /100 | #312 | Tragic $40,287 |
| Choctaw | 0.0 /100 | #313 | Tragic $40,270 |
| Cheyenne | 0.0 /100 | #314 | Tragic $40,233 |
| Seminole | 0.0 /100 | #315 | Tragic $40,233 |
| Immigrants | Honduras | 0.0 /100 | #316 | Tragic $40,195 |
| Fijians | 0.0 /100 | #317 | Tragic $40,193 |
| Dutch West Indians | 0.0 /100 | #318 | Tragic $40,107 |
| Blacks/African Americans | 0.0 /100 | #319 | Tragic $40,085 |
| Immigrants | Bahamas | 0.0 /100 | #320 | Tragic $39,861 |
| Mexicans | 0.0 /100 | #321 | Tragic $39,834 |
| Immigrants | Central America | 0.0 /100 | #322 | Tragic $39,762 |
| Bahamians | 0.0 /100 | #323 | Tragic $39,735 |