Welsh vs Chippewa Median Family Income
COMPARE
Welsh
Chippewa
Median Family Income
Median Family Income Comparison
Welsh
Chippewa
$102,151
MEDIAN FAMILY INCOME
43.3/ 100
METRIC RATING
178th/ 347
METRIC RANK
$86,852
MEDIAN FAMILY INCOME
0.0/ 100
METRIC RATING
299th/ 347
METRIC RANK
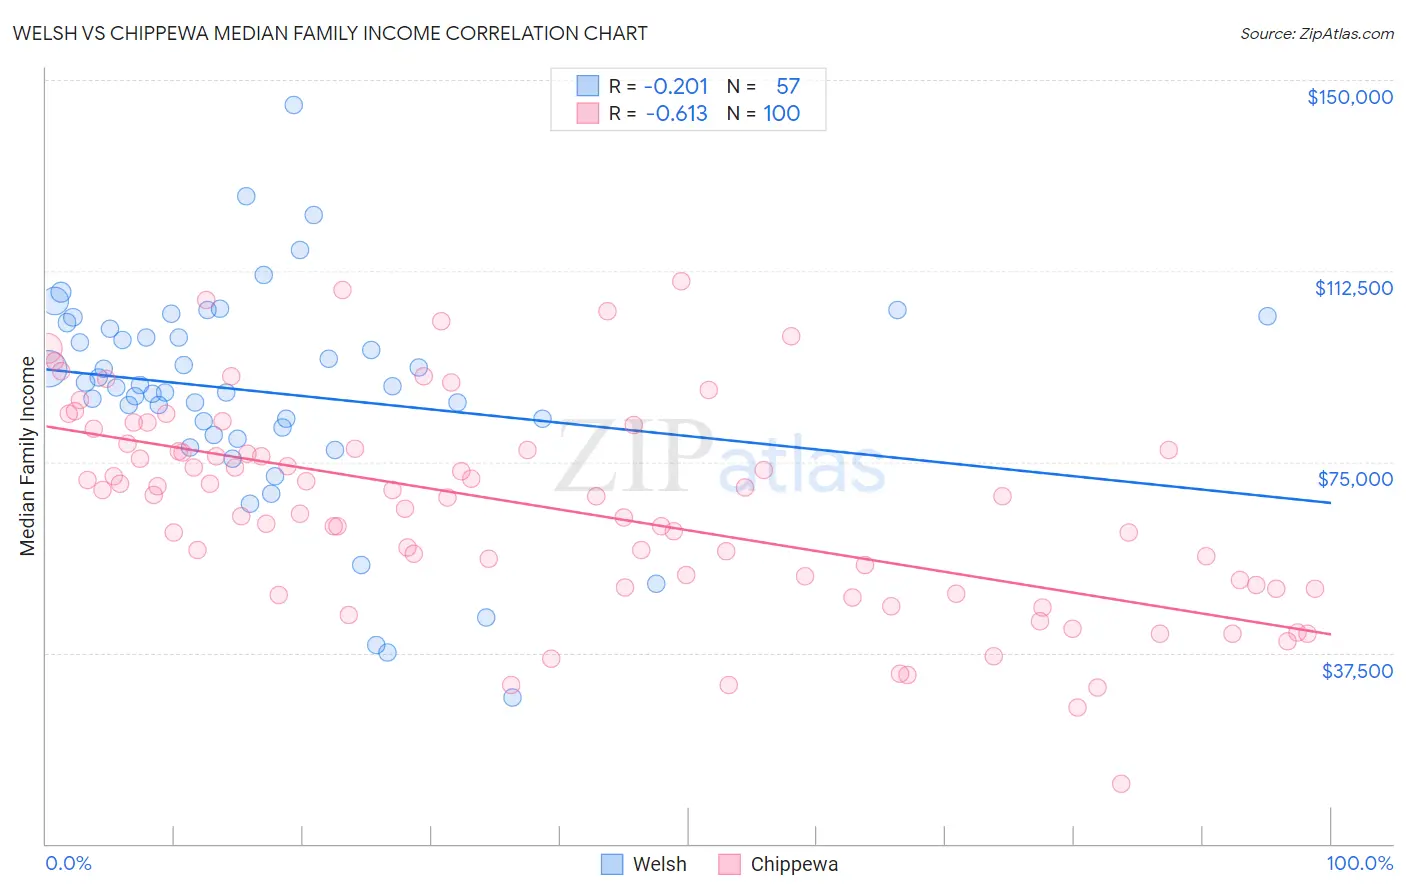
Welsh vs Chippewa Median Family Income Correlation Chart
The statistical analysis conducted on geographies consisting of 527,824,493 people shows a weak negative correlation between the proportion of Welsh and median family income in the United States with a correlation coefficient (R) of -0.201 and weighted average of $102,151. Similarly, the statistical analysis conducted on geographies consisting of 214,970,726 people shows a significant negative correlation between the proportion of Chippewa and median family income in the United States with a correlation coefficient (R) of -0.613 and weighted average of $86,852, a difference of 17.6%.
Median Family Income Correlation Summary
| Measurement | Welsh | Chippewa |
| Minimum | $28,750 | $11,667 |
| Maximum | $145,055 | $110,455 |
| Range | $116,305 | $98,788 |
| Mean | $88,686 | $65,965 |
| Median | $89,832 | $68,273 |
| Interquartile 25% (IQ1) | $80,992 | $50,598 |
| Interquartile 75% (IQ3) | $101,775 | $77,379 |
| Interquartile Range (IQR) | $20,783 | $26,781 |
| Standard Deviation (Sample) | $21,326 | $20,173 |
| Standard Deviation (Population) | $21,138 | $20,072 |
Similar Demographics by Median Family Income
Demographics Similar to Welsh by Median Family Income
In terms of median family income, the demographic groups most similar to Welsh are German ($102,254, a difference of 0.10%), French ($102,368, a difference of 0.21%), Immigrants from Eastern Africa ($102,451, a difference of 0.29%), South American ($101,856, a difference of 0.29%), and Finnish ($102,676, a difference of 0.51%).
| Demographics | Rating | Rank | Median Family Income |
| Alsatians | 54.3 /100 | #171 | Average $103,010 |
| Immigrants | Eritrea | 51.9 /100 | #172 | Average $102,823 |
| Belgians | 51.4 /100 | #173 | Average $102,788 |
| Finns | 50.0 /100 | #174 | Average $102,676 |
| Immigrants | Eastern Africa | 47.1 /100 | #175 | Average $102,451 |
| French | 46.1 /100 | #176 | Average $102,368 |
| Germans | 44.6 /100 | #177 | Average $102,254 |
| Welsh | 43.3 /100 | #178 | Average $102,151 |
| South Americans | 39.7 /100 | #179 | Fair $101,856 |
| French Canadians | 37.0 /100 | #180 | Fair $101,634 |
| Spaniards | 36.8 /100 | #181 | Fair $101,617 |
| Tsimshian | 35.9 /100 | #182 | Fair $101,543 |
| Kenyans | 34.5 /100 | #183 | Fair $101,417 |
| Immigrants | Costa Rica | 33.7 /100 | #184 | Fair $101,354 |
| Dutch | 31.9 /100 | #185 | Fair $101,192 |
Demographics Similar to Chippewa by Median Family Income
In terms of median family income, the demographic groups most similar to Chippewa are Immigrants from Latin America ($86,989, a difference of 0.16%), Cajun ($87,157, a difference of 0.35%), Immigrants from Guatemala ($87,191, a difference of 0.39%), Yaqui ($87,289, a difference of 0.50%), and Ottawa ($86,380, a difference of 0.55%).
| Demographics | Rating | Rank | Median Family Income |
| Africans | 0.1 /100 | #292 | Tragic $87,820 |
| Ute | 0.0 /100 | #293 | Tragic $87,596 |
| Fijians | 0.0 /100 | #294 | Tragic $87,387 |
| Yaqui | 0.0 /100 | #295 | Tragic $87,289 |
| Immigrants | Guatemala | 0.0 /100 | #296 | Tragic $87,191 |
| Cajuns | 0.0 /100 | #297 | Tragic $87,157 |
| Immigrants | Latin America | 0.0 /100 | #298 | Tragic $86,989 |
| Chippewa | 0.0 /100 | #299 | Tragic $86,852 |
| Ottawa | 0.0 /100 | #300 | Tragic $86,380 |
| Colville | 0.0 /100 | #301 | Tragic $85,792 |
| Spanish American Indians | 0.0 /100 | #302 | Tragic $85,728 |
| Hispanics or Latinos | 0.0 /100 | #303 | Tragic $85,647 |
| Mexicans | 0.0 /100 | #304 | Tragic $85,618 |
| Paiute | 0.0 /100 | #305 | Tragic $85,414 |
| Immigrants | Dominica | 0.0 /100 | #306 | Tragic $85,411 |