Welsh vs Native/Alaskan Ambulatory Disability
COMPARE
Welsh
Native/Alaskan
Ambulatory Disability
Ambulatory Disability Comparison
Welsh
Natives/Alaskans
6.5%
AMBULATORY DISABILITY
0.6/ 100
METRIC RATING
255th/ 347
METRIC RANK
7.5%
AMBULATORY DISABILITY
0.0/ 100
METRIC RATING
327th/ 347
METRIC RANK
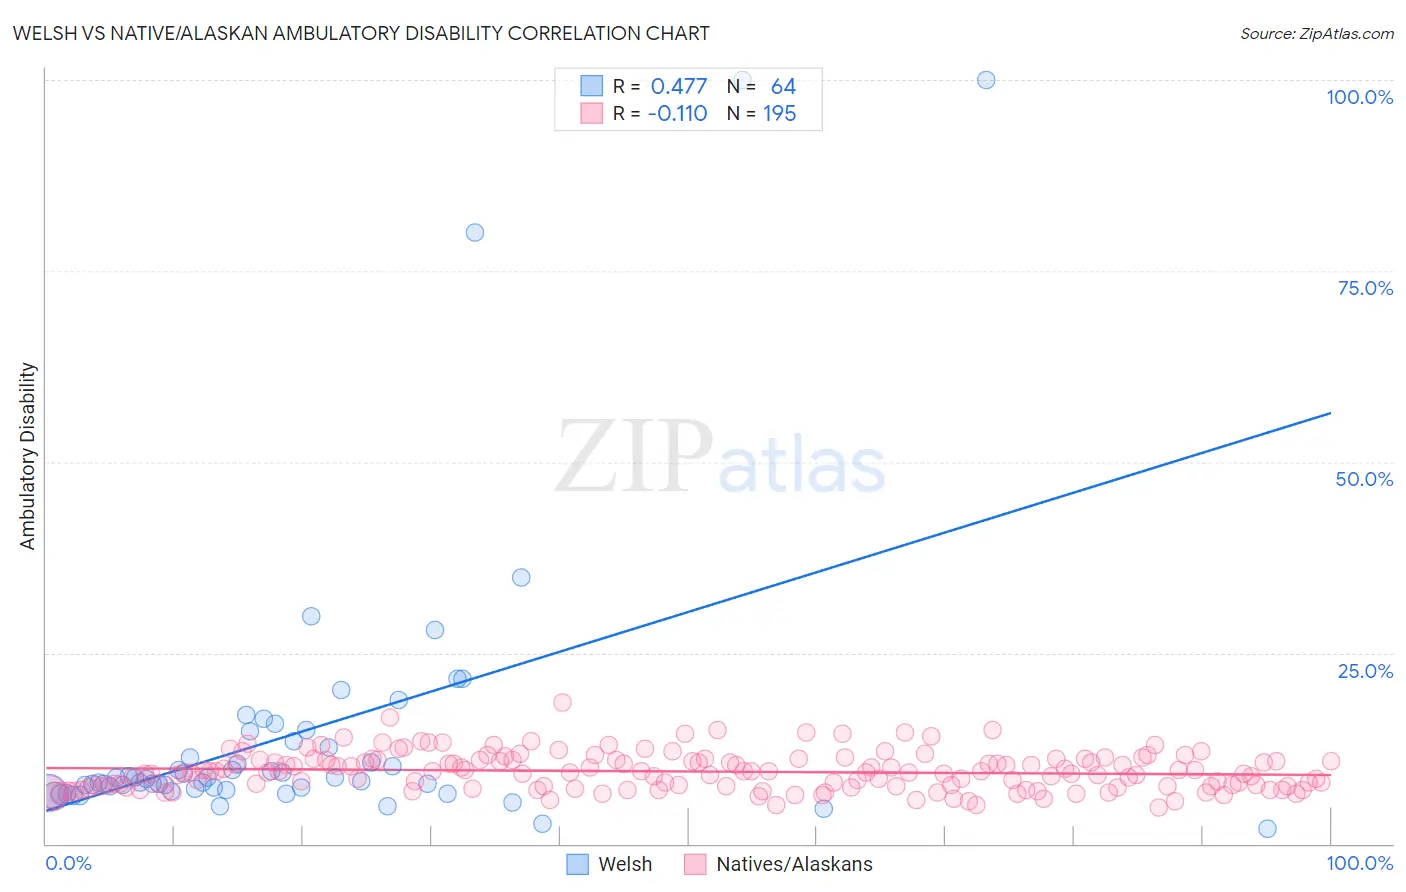
Welsh vs Native/Alaskan Ambulatory Disability Correlation Chart
The statistical analysis conducted on geographies consisting of 528,297,668 people shows a moderate positive correlation between the proportion of Welsh and percentage of population with ambulatory disability in the United States with a correlation coefficient (R) of 0.477 and weighted average of 6.5%. Similarly, the statistical analysis conducted on geographies consisting of 512,715,386 people shows a poor negative correlation between the proportion of Natives/Alaskans and percentage of population with ambulatory disability in the United States with a correlation coefficient (R) of -0.110 and weighted average of 7.5%, a difference of 15.2%.
Ambulatory Disability Correlation Summary
| Measurement | Welsh | Native/Alaskan |
| Minimum | 2.0% | 4.7% |
| Maximum | 100.0% | 18.5% |
| Range | 98.0% | 13.8% |
| Mean | 14.3% | 9.5% |
| Median | 8.3% | 9.4% |
| Interquartile 25% (IQ1) | 7.1% | 7.5% |
| Interquartile 75% (IQ3) | 13.0% | 11.0% |
| Interquartile Range (IQR) | 5.9% | 3.5% |
| Standard Deviation (Sample) | 18.8% | 2.4% |
| Standard Deviation (Population) | 18.7% | 2.4% |
Similar Demographics by Ambulatory Disability
Demographics Similar to Welsh by Ambulatory Disability
In terms of ambulatory disability, the demographic groups most similar to Welsh are Belizean (6.5%, a difference of 0.070%), Immigrants from Uzbekistan (6.5%, a difference of 0.080%), Bermudan (6.5%, a difference of 0.16%), Scottish (6.5%, a difference of 0.23%), and Spanish American Indian (6.5%, a difference of 0.23%).
| Demographics | Rating | Rank | Ambulatory Disability |
| Immigrants | Portugal | 1.4 /100 | #248 | Tragic 6.5% |
| Native Hawaiians | 1.1 /100 | #249 | Tragic 6.5% |
| Chinese | 1.0 /100 | #250 | Tragic 6.5% |
| Hawaiians | 0.9 /100 | #251 | Tragic 6.5% |
| Immigrants | Bahamas | 0.8 /100 | #252 | Tragic 6.5% |
| Scottish | 0.7 /100 | #253 | Tragic 6.5% |
| Belizeans | 0.7 /100 | #254 | Tragic 6.5% |
| Welsh | 0.6 /100 | #255 | Tragic 6.5% |
| Immigrants | Uzbekistan | 0.6 /100 | #256 | Tragic 6.5% |
| Bermudans | 0.5 /100 | #257 | Tragic 6.5% |
| Spanish American Indians | 0.5 /100 | #258 | Tragic 6.5% |
| Aleuts | 0.4 /100 | #259 | Tragic 6.6% |
| Immigrants | Belize | 0.4 /100 | #260 | Tragic 6.6% |
| Irish | 0.4 /100 | #261 | Tragic 6.6% |
| English | 0.4 /100 | #262 | Tragic 6.6% |
Demographics Similar to Natives/Alaskans by Ambulatory Disability
In terms of ambulatory disability, the demographic groups most similar to Natives/Alaskans are Black/African American (7.5%, a difference of 0.010%), Comanche (7.5%, a difference of 0.12%), Navajo (7.5%, a difference of 0.20%), Hopi (7.6%, a difference of 0.94%), and Pueblo (7.6%, a difference of 0.98%).
| Demographics | Rating | Rank | Ambulatory Disability |
| Potawatomi | 0.0 /100 | #320 | Tragic 7.3% |
| Apache | 0.0 /100 | #321 | Tragic 7.4% |
| Osage | 0.0 /100 | #322 | Tragic 7.4% |
| Americans | 0.0 /100 | #323 | Tragic 7.4% |
| Navajo | 0.0 /100 | #324 | Tragic 7.5% |
| Comanche | 0.0 /100 | #325 | Tragic 7.5% |
| Blacks/African Americans | 0.0 /100 | #326 | Tragic 7.5% |
| Natives/Alaskans | 0.0 /100 | #327 | Tragic 7.5% |
| Hopi | 0.0 /100 | #328 | Tragic 7.6% |
| Pueblo | 0.0 /100 | #329 | Tragic 7.6% |
| Paiute | 0.0 /100 | #330 | Tragic 7.7% |
| Cajuns | 0.0 /100 | #331 | Tragic 7.8% |
| Menominee | 0.0 /100 | #332 | Tragic 7.8% |
| Cherokee | 0.0 /100 | #333 | Tragic 7.9% |
| Yuman | 0.0 /100 | #334 | Tragic 7.9% |