Ute vs Immigrants from Latin America Ambulatory Disability
COMPARE
Ute
Immigrants from Latin America
Ambulatory Disability
Ambulatory Disability Comparison
Ute
Immigrants from Latin America
6.0%
AMBULATORY DISABILITY
86.6/ 100
METRIC RATING
134th/ 347
METRIC RANK
6.3%
AMBULATORY DISABILITY
11.0/ 100
METRIC RATING
215th/ 347
METRIC RANK
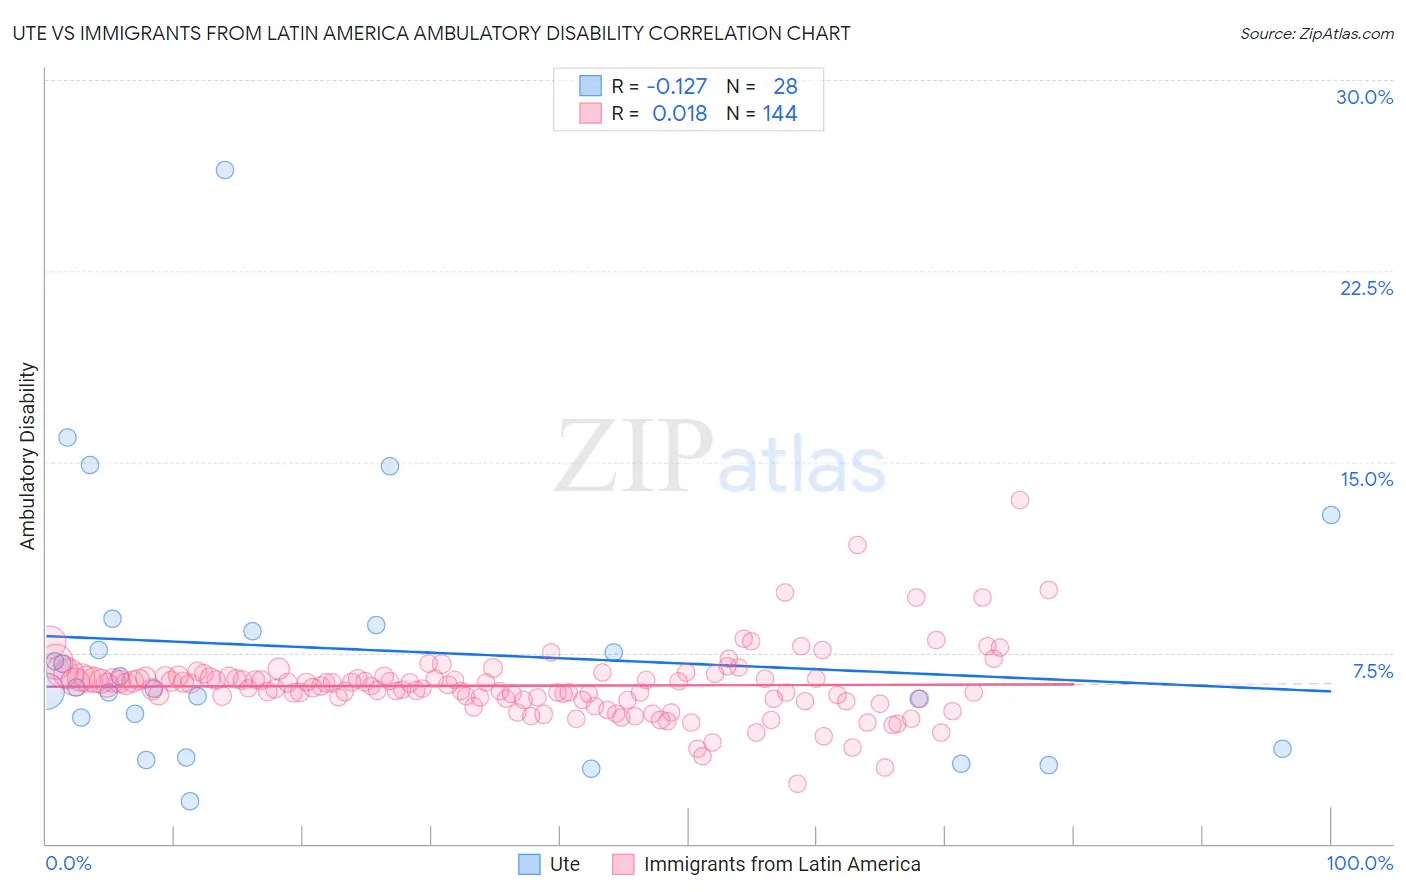
Ute vs Immigrants from Latin America Ambulatory Disability Correlation Chart
The statistical analysis conducted on geographies consisting of 55,667,207 people shows a poor negative correlation between the proportion of Ute and percentage of population with ambulatory disability in the United States with a correlation coefficient (R) of -0.127 and weighted average of 6.0%. Similarly, the statistical analysis conducted on geographies consisting of 558,117,601 people shows no correlation between the proportion of Immigrants from Latin America and percentage of population with ambulatory disability in the United States with a correlation coefficient (R) of 0.018 and weighted average of 6.3%, a difference of 5.4%.
Ambulatory Disability Correlation Summary
| Measurement | Ute | Immigrants from Latin America |
| Minimum | 1.7% | 2.4% |
| Maximum | 26.5% | 13.5% |
| Range | 24.8% | 11.1% |
| Mean | 7.6% | 6.2% |
| Median | 6.1% | 6.2% |
| Interquartile 25% (IQ1) | 4.3% | 5.7% |
| Interquartile 75% (IQ3) | 8.5% | 6.5% |
| Interquartile Range (IQR) | 4.1% | 0.86% |
| Standard Deviation (Sample) | 5.2% | 1.4% |
| Standard Deviation (Population) | 5.1% | 1.4% |
Similar Demographics by Ambulatory Disability
Demographics Similar to Ute by Ambulatory Disability
In terms of ambulatory disability, the demographic groups most similar to Ute are Immigrants (6.0%, a difference of 0.040%), Immigrants from Europe (6.0%, a difference of 0.15%), Immigrants from Italy (6.0%, a difference of 0.18%), Immigrants from North Macedonia (6.0%, a difference of 0.27%), and Immigrants from Syria (6.0%, a difference of 0.27%).
| Demographics | Rating | Rank | Ambulatory Disability |
| Immigrants | Nigeria | 90.9 /100 | #127 | Exceptional 5.9% |
| Immigrants | Western Asia | 90.7 /100 | #128 | Exceptional 5.9% |
| Immigrants | Norway | 90.5 /100 | #129 | Exceptional 5.9% |
| Immigrants | Kazakhstan | 89.7 /100 | #130 | Excellent 5.9% |
| Immigrants | Costa Rica | 89.5 /100 | #131 | Excellent 5.9% |
| Immigrants | Europe | 87.8 /100 | #132 | Excellent 6.0% |
| Immigrants | Immigrants | 86.9 /100 | #133 | Excellent 6.0% |
| Ute | 86.6 /100 | #134 | Excellent 6.0% |
| Immigrants | Italy | 85.0 /100 | #135 | Excellent 6.0% |
| Immigrants | North Macedonia | 84.1 /100 | #136 | Excellent 6.0% |
| Immigrants | Syria | 84.1 /100 | #137 | Excellent 6.0% |
| Immigrants | Hungary | 83.9 /100 | #138 | Excellent 6.0% |
| Immigrants | Zaire | 83.6 /100 | #139 | Excellent 6.0% |
| Czechs | 83.3 /100 | #140 | Excellent 6.0% |
| Swedes | 83.1 /100 | #141 | Excellent 6.0% |
Demographics Similar to Immigrants from Latin America by Ambulatory Disability
In terms of ambulatory disability, the demographic groups most similar to Immigrants from Latin America are Immigrants from Mexico (6.3%, a difference of 0.010%), Canadian (6.3%, a difference of 0.010%), Yugoslavian (6.3%, a difference of 0.010%), Guamanian/Chamorro (6.3%, a difference of 0.050%), and Mexican American Indian (6.3%, a difference of 0.13%).
| Demographics | Rating | Rank | Ambulatory Disability |
| Bangladeshis | 14.2 /100 | #208 | Poor 6.3% |
| Immigrants | Iraq | 14.0 /100 | #209 | Poor 6.3% |
| Immigrants | Laos | 13.2 /100 | #210 | Poor 6.3% |
| Samoans | 12.1 /100 | #211 | Poor 6.3% |
| Mexican American Indians | 12.0 /100 | #212 | Poor 6.3% |
| Japanese | 12.0 /100 | #213 | Poor 6.3% |
| Immigrants | Mexico | 11.0 /100 | #214 | Poor 6.3% |
| Immigrants | Latin America | 11.0 /100 | #215 | Poor 6.3% |
| Canadians | 10.9 /100 | #216 | Poor 6.3% |
| Yugoslavians | 10.9 /100 | #217 | Poor 6.3% |
| Guamanians/Chamorros | 10.6 /100 | #218 | Poor 6.3% |
| Indonesians | 9.9 /100 | #219 | Tragic 6.3% |
| Immigrants | Albania | 9.6 /100 | #220 | Tragic 6.3% |
| Hungarians | 9.6 /100 | #221 | Tragic 6.3% |
| German Russians | 9.4 /100 | #222 | Tragic 6.3% |