Ute vs Yuman Ambulatory Disability
COMPARE
Ute
Yuman
Ambulatory Disability
Ambulatory Disability Comparison
Ute
Yuman
6.0%
AMBULATORY DISABILITY
86.6/ 100
METRIC RATING
134th/ 347
METRIC RANK
7.9%
AMBULATORY DISABILITY
0.0/ 100
METRIC RATING
334th/ 347
METRIC RANK
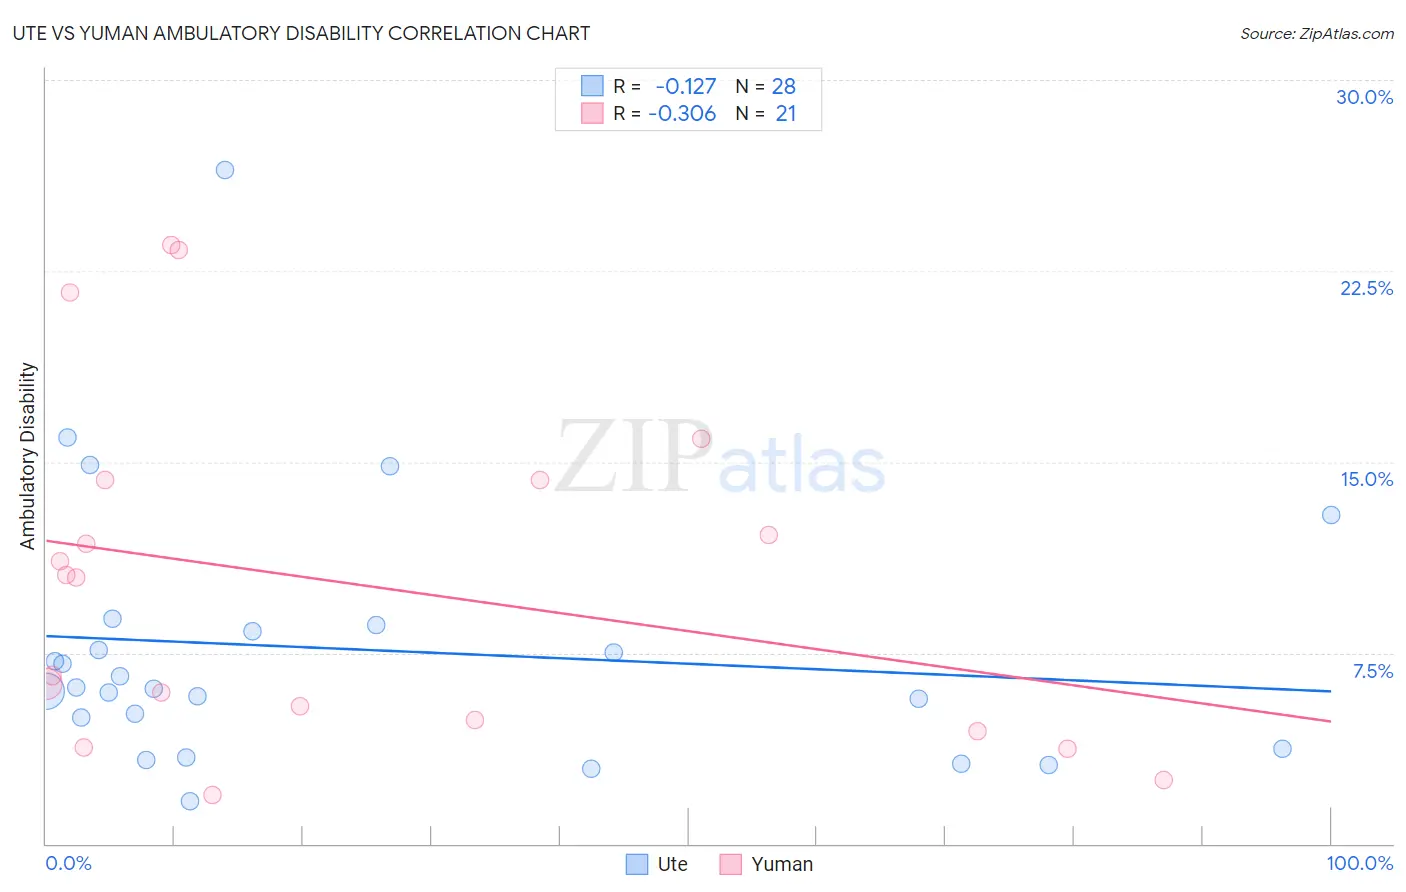
Ute vs Yuman Ambulatory Disability Correlation Chart
The statistical analysis conducted on geographies consisting of 55,667,207 people shows a poor negative correlation between the proportion of Ute and percentage of population with ambulatory disability in the United States with a correlation coefficient (R) of -0.127 and weighted average of 6.0%. Similarly, the statistical analysis conducted on geographies consisting of 40,645,433 people shows a mild negative correlation between the proportion of Yuman and percentage of population with ambulatory disability in the United States with a correlation coefficient (R) of -0.306 and weighted average of 7.9%, a difference of 33.2%.
Ambulatory Disability Correlation Summary
| Measurement | Ute | Yuman |
| Minimum | 1.7% | 1.9% |
| Maximum | 26.5% | 23.5% |
| Range | 24.8% | 21.6% |
| Mean | 7.6% | 10.2% |
| Median | 6.1% | 10.5% |
| Interquartile 25% (IQ1) | 4.3% | 4.6% |
| Interquartile 75% (IQ3) | 8.5% | 14.3% |
| Interquartile Range (IQR) | 4.1% | 9.7% |
| Standard Deviation (Sample) | 5.2% | 6.7% |
| Standard Deviation (Population) | 5.1% | 6.5% |
Similar Demographics by Ambulatory Disability
Demographics Similar to Ute by Ambulatory Disability
In terms of ambulatory disability, the demographic groups most similar to Ute are Immigrants (6.0%, a difference of 0.040%), Immigrants from Europe (6.0%, a difference of 0.15%), Immigrants from Italy (6.0%, a difference of 0.18%), Immigrants from North Macedonia (6.0%, a difference of 0.27%), and Immigrants from Syria (6.0%, a difference of 0.27%).
| Demographics | Rating | Rank | Ambulatory Disability |
| Immigrants | Nigeria | 90.9 /100 | #127 | Exceptional 5.9% |
| Immigrants | Western Asia | 90.7 /100 | #128 | Exceptional 5.9% |
| Immigrants | Norway | 90.5 /100 | #129 | Exceptional 5.9% |
| Immigrants | Kazakhstan | 89.7 /100 | #130 | Excellent 5.9% |
| Immigrants | Costa Rica | 89.5 /100 | #131 | Excellent 5.9% |
| Immigrants | Europe | 87.8 /100 | #132 | Excellent 6.0% |
| Immigrants | Immigrants | 86.9 /100 | #133 | Excellent 6.0% |
| Ute | 86.6 /100 | #134 | Excellent 6.0% |
| Immigrants | Italy | 85.0 /100 | #135 | Excellent 6.0% |
| Immigrants | North Macedonia | 84.1 /100 | #136 | Excellent 6.0% |
| Immigrants | Syria | 84.1 /100 | #137 | Excellent 6.0% |
| Immigrants | Hungary | 83.9 /100 | #138 | Excellent 6.0% |
| Immigrants | Zaire | 83.6 /100 | #139 | Excellent 6.0% |
| Czechs | 83.3 /100 | #140 | Excellent 6.0% |
| Swedes | 83.1 /100 | #141 | Excellent 6.0% |
Demographics Similar to Yuman by Ambulatory Disability
In terms of ambulatory disability, the demographic groups most similar to Yuman are Cherokee (7.9%, a difference of 0.94%), Chickasaw (8.0%, a difference of 1.1%), Seminole (8.0%, a difference of 1.2%), Menominee (7.8%, a difference of 1.8%), and Cajun (7.8%, a difference of 2.1%).
| Demographics | Rating | Rank | Ambulatory Disability |
| Natives/Alaskans | 0.0 /100 | #327 | Tragic 7.5% |
| Hopi | 0.0 /100 | #328 | Tragic 7.6% |
| Pueblo | 0.0 /100 | #329 | Tragic 7.6% |
| Paiute | 0.0 /100 | #330 | Tragic 7.7% |
| Cajuns | 0.0 /100 | #331 | Tragic 7.8% |
| Menominee | 0.0 /100 | #332 | Tragic 7.8% |
| Cherokee | 0.0 /100 | #333 | Tragic 7.9% |
| Yuman | 0.0 /100 | #334 | Tragic 7.9% |
| Chickasaw | 0.0 /100 | #335 | Tragic 8.0% |
| Seminole | 0.0 /100 | #336 | Tragic 8.0% |
| Dutch West Indians | 0.0 /100 | #337 | Tragic 8.2% |
| Colville | 0.0 /100 | #338 | Tragic 8.2% |
| Pima | 0.0 /100 | #339 | Tragic 8.2% |
| Choctaw | 0.0 /100 | #340 | Tragic 8.3% |
| Creek | 0.0 /100 | #341 | Tragic 8.5% |