Ute vs Guatemalan Ambulatory Disability
COMPARE
Ute
Guatemalan
Ambulatory Disability
Ambulatory Disability Comparison
Ute
Guatemalans
6.0%
AMBULATORY DISABILITY
86.6/ 100
METRIC RATING
134th/ 347
METRIC RANK
6.2%
AMBULATORY DISABILITY
30.0/ 100
METRIC RATING
193rd/ 347
METRIC RANK
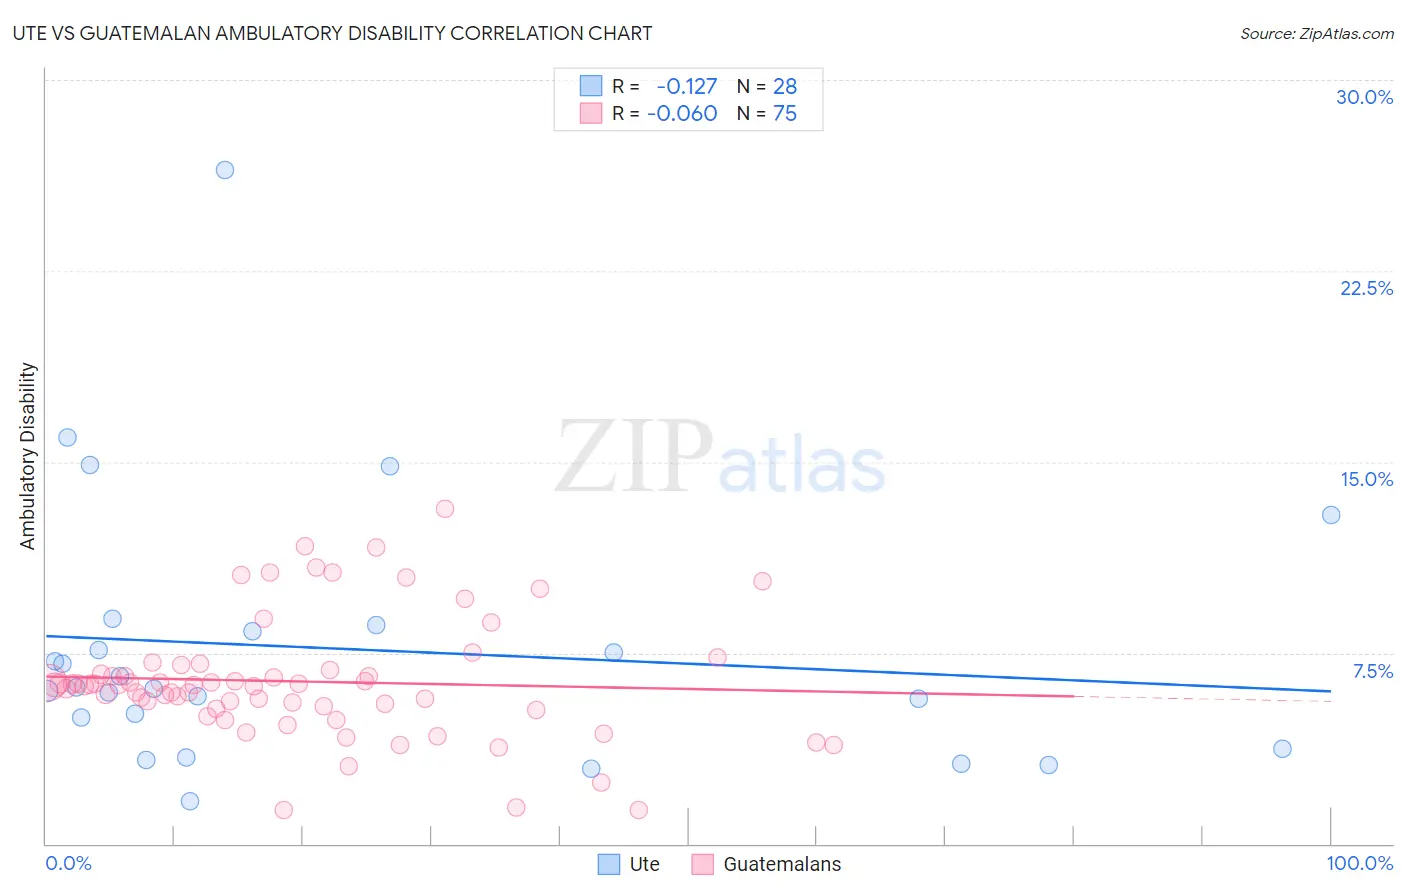
Ute vs Guatemalan Ambulatory Disability Correlation Chart
The statistical analysis conducted on geographies consisting of 55,667,207 people shows a poor negative correlation between the proportion of Ute and percentage of population with ambulatory disability in the United States with a correlation coefficient (R) of -0.127 and weighted average of 6.0%. Similarly, the statistical analysis conducted on geographies consisting of 409,382,771 people shows a slight negative correlation between the proportion of Guatemalans and percentage of population with ambulatory disability in the United States with a correlation coefficient (R) of -0.060 and weighted average of 6.2%, a difference of 3.7%.
Ambulatory Disability Correlation Summary
| Measurement | Ute | Guatemalan |
| Minimum | 1.7% | 1.3% |
| Maximum | 26.5% | 13.2% |
| Range | 24.8% | 11.9% |
| Mean | 7.6% | 6.4% |
| Median | 6.1% | 6.2% |
| Interquartile 25% (IQ1) | 4.3% | 5.3% |
| Interquartile 75% (IQ3) | 8.5% | 6.8% |
| Interquartile Range (IQR) | 4.1% | 1.5% |
| Standard Deviation (Sample) | 5.2% | 2.4% |
| Standard Deviation (Population) | 5.1% | 2.3% |
Similar Demographics by Ambulatory Disability
Demographics Similar to Ute by Ambulatory Disability
In terms of ambulatory disability, the demographic groups most similar to Ute are Immigrants (6.0%, a difference of 0.040%), Immigrants from Europe (6.0%, a difference of 0.15%), Immigrants from Italy (6.0%, a difference of 0.18%), Immigrants from North Macedonia (6.0%, a difference of 0.27%), and Immigrants from Syria (6.0%, a difference of 0.27%).
| Demographics | Rating | Rank | Ambulatory Disability |
| Immigrants | Nigeria | 90.9 /100 | #127 | Exceptional 5.9% |
| Immigrants | Western Asia | 90.7 /100 | #128 | Exceptional 5.9% |
| Immigrants | Norway | 90.5 /100 | #129 | Exceptional 5.9% |
| Immigrants | Kazakhstan | 89.7 /100 | #130 | Excellent 5.9% |
| Immigrants | Costa Rica | 89.5 /100 | #131 | Excellent 5.9% |
| Immigrants | Europe | 87.8 /100 | #132 | Excellent 6.0% |
| Immigrants | Immigrants | 86.9 /100 | #133 | Excellent 6.0% |
| Ute | 86.6 /100 | #134 | Excellent 6.0% |
| Immigrants | Italy | 85.0 /100 | #135 | Excellent 6.0% |
| Immigrants | North Macedonia | 84.1 /100 | #136 | Excellent 6.0% |
| Immigrants | Syria | 84.1 /100 | #137 | Excellent 6.0% |
| Immigrants | Hungary | 83.9 /100 | #138 | Excellent 6.0% |
| Immigrants | Zaire | 83.6 /100 | #139 | Excellent 6.0% |
| Czechs | 83.3 /100 | #140 | Excellent 6.0% |
| Swedes | 83.1 /100 | #141 | Excellent 6.0% |
Demographics Similar to Guatemalans by Ambulatory Disability
In terms of ambulatory disability, the demographic groups most similar to Guatemalans are Alaska Native (6.2%, a difference of 0.010%), Belgian (6.2%, a difference of 0.080%), Immigrants from Western Europe (6.2%, a difference of 0.10%), Malaysian (6.2%, a difference of 0.11%), and Immigrants from Guatemala (6.2%, a difference of 0.12%).
| Demographics | Rating | Rank | Ambulatory Disability |
| Europeans | 36.2 /100 | #186 | Fair 6.2% |
| Carpatho Rusyns | 35.3 /100 | #187 | Fair 6.2% |
| British | 34.3 /100 | #188 | Fair 6.2% |
| Ukrainians | 34.0 /100 | #189 | Fair 6.2% |
| Immigrants | Western Africa | 33.4 /100 | #190 | Fair 6.2% |
| Immigrants | Guatemala | 31.9 /100 | #191 | Fair 6.2% |
| Immigrants | Western Europe | 31.6 /100 | #192 | Fair 6.2% |
| Guatemalans | 30.0 /100 | #193 | Fair 6.2% |
| Alaska Natives | 29.8 /100 | #194 | Fair 6.2% |
| Belgians | 28.6 /100 | #195 | Fair 6.2% |
| Malaysians | 28.2 /100 | #196 | Fair 6.2% |
| Poles | 26.3 /100 | #197 | Fair 6.2% |
| Immigrants | Bangladesh | 24.6 /100 | #198 | Fair 6.2% |
| Italians | 22.6 /100 | #199 | Fair 6.2% |
| Immigrants | Cambodia | 21.5 /100 | #200 | Fair 6.2% |