Ute vs Barbadian Ambulatory Disability
COMPARE
Ute
Barbadian
Ambulatory Disability
Ambulatory Disability Comparison
Ute
Barbadians
6.0%
AMBULATORY DISABILITY
86.6/ 100
METRIC RATING
134th/ 347
METRIC RANK
6.8%
AMBULATORY DISABILITY
0.0/ 100
METRIC RATING
282nd/ 347
METRIC RANK
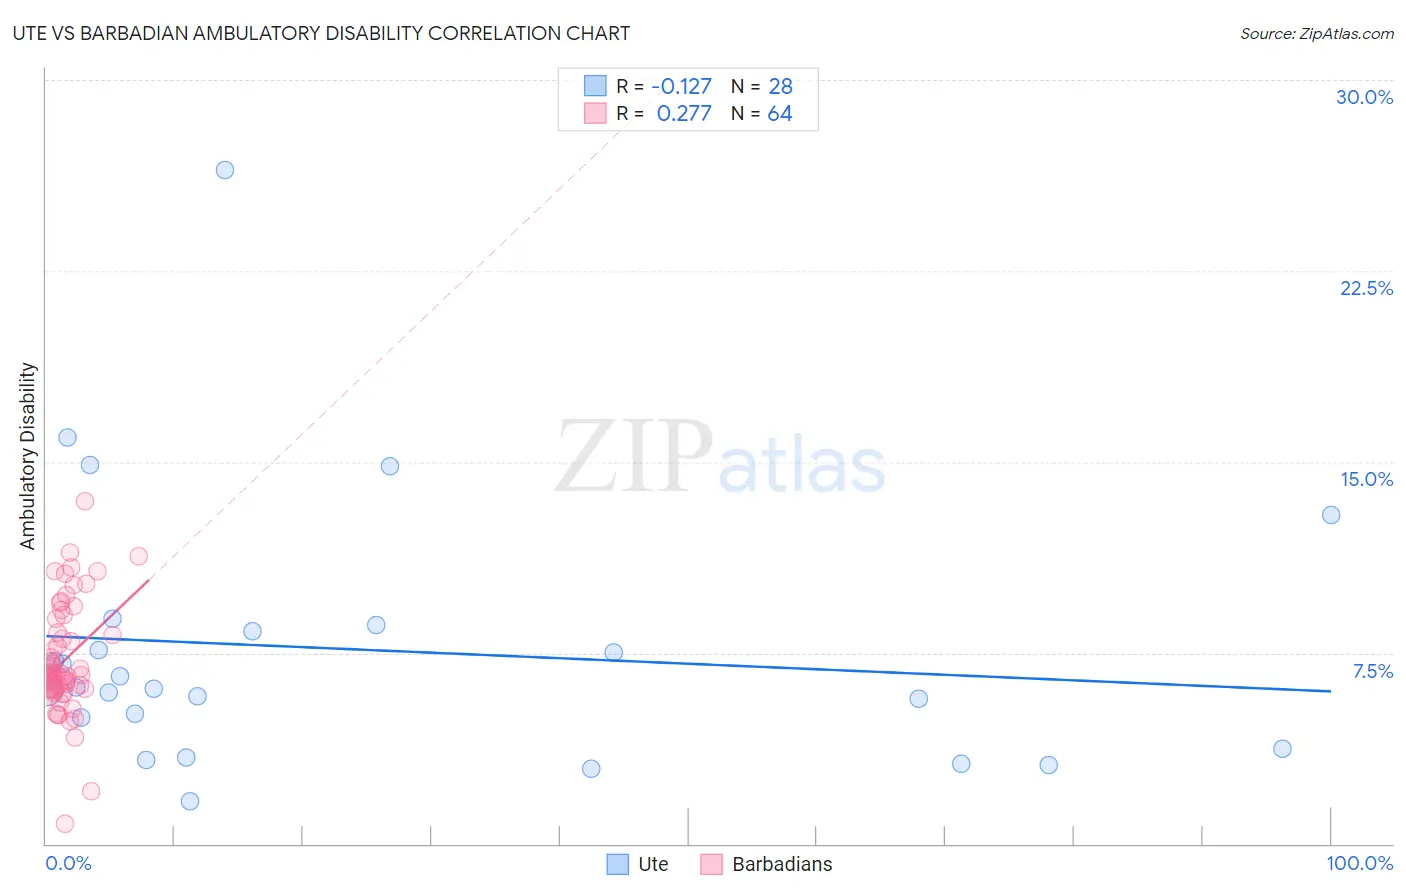
Ute vs Barbadian Ambulatory Disability Correlation Chart
The statistical analysis conducted on geographies consisting of 55,667,207 people shows a poor negative correlation between the proportion of Ute and percentage of population with ambulatory disability in the United States with a correlation coefficient (R) of -0.127 and weighted average of 6.0%. Similarly, the statistical analysis conducted on geographies consisting of 141,286,079 people shows a weak positive correlation between the proportion of Barbadians and percentage of population with ambulatory disability in the United States with a correlation coefficient (R) of 0.277 and weighted average of 6.8%, a difference of 13.4%.
Ambulatory Disability Correlation Summary
| Measurement | Ute | Barbadian |
| Minimum | 1.7% | 0.77% |
| Maximum | 26.5% | 13.4% |
| Range | 24.8% | 12.7% |
| Mean | 7.6% | 7.2% |
| Median | 6.1% | 6.7% |
| Interquartile 25% (IQ1) | 4.3% | 6.1% |
| Interquartile 75% (IQ3) | 8.5% | 8.6% |
| Interquartile Range (IQR) | 4.1% | 2.5% |
| Standard Deviation (Sample) | 5.2% | 2.2% |
| Standard Deviation (Population) | 5.1% | 2.2% |
Similar Demographics by Ambulatory Disability
Demographics Similar to Ute by Ambulatory Disability
In terms of ambulatory disability, the demographic groups most similar to Ute are Immigrants (6.0%, a difference of 0.040%), Immigrants from Europe (6.0%, a difference of 0.15%), Immigrants from Italy (6.0%, a difference of 0.18%), Immigrants from North Macedonia (6.0%, a difference of 0.27%), and Immigrants from Syria (6.0%, a difference of 0.27%).
| Demographics | Rating | Rank | Ambulatory Disability |
| Immigrants | Nigeria | 90.9 /100 | #127 | Exceptional 5.9% |
| Immigrants | Western Asia | 90.7 /100 | #128 | Exceptional 5.9% |
| Immigrants | Norway | 90.5 /100 | #129 | Exceptional 5.9% |
| Immigrants | Kazakhstan | 89.7 /100 | #130 | Excellent 5.9% |
| Immigrants | Costa Rica | 89.5 /100 | #131 | Excellent 5.9% |
| Immigrants | Europe | 87.8 /100 | #132 | Excellent 6.0% |
| Immigrants | Immigrants | 86.9 /100 | #133 | Excellent 6.0% |
| Ute | 86.6 /100 | #134 | Excellent 6.0% |
| Immigrants | Italy | 85.0 /100 | #135 | Excellent 6.0% |
| Immigrants | North Macedonia | 84.1 /100 | #136 | Excellent 6.0% |
| Immigrants | Syria | 84.1 /100 | #137 | Excellent 6.0% |
| Immigrants | Hungary | 83.9 /100 | #138 | Excellent 6.0% |
| Immigrants | Zaire | 83.6 /100 | #139 | Excellent 6.0% |
| Czechs | 83.3 /100 | #140 | Excellent 6.0% |
| Swedes | 83.1 /100 | #141 | Excellent 6.0% |
Demographics Similar to Barbadians by Ambulatory Disability
In terms of ambulatory disability, the demographic groups most similar to Barbadians are Yaqui (6.8%, a difference of 0.13%), Immigrants from Barbados (6.8%, a difference of 0.16%), Pennsylvania German (6.8%, a difference of 0.20%), Immigrants from Jamaica (6.8%, a difference of 0.23%), and Immigrants from Caribbean (6.7%, a difference of 0.30%).
| Demographics | Rating | Rank | Ambulatory Disability |
| Immigrants | Guyana | 0.1 /100 | #275 | Tragic 6.7% |
| Celtics | 0.1 /100 | #276 | Tragic 6.7% |
| Jamaicans | 0.1 /100 | #277 | Tragic 6.7% |
| Immigrants | West Indies | 0.1 /100 | #278 | Tragic 6.7% |
| Immigrants | Caribbean | 0.0 /100 | #279 | Tragic 6.7% |
| Pennsylvania Germans | 0.0 /100 | #280 | Tragic 6.8% |
| Yaqui | 0.0 /100 | #281 | Tragic 6.8% |
| Barbadians | 0.0 /100 | #282 | Tragic 6.8% |
| Immigrants | Barbados | 0.0 /100 | #283 | Tragic 6.8% |
| Immigrants | Jamaica | 0.0 /100 | #284 | Tragic 6.8% |
| Fijians | 0.0 /100 | #285 | Tragic 6.8% |
| Yakama | 0.0 /100 | #286 | Tragic 6.8% |
| U.S. Virgin Islanders | 0.0 /100 | #287 | Tragic 6.8% |
| Immigrants | Nonimmigrants | 0.0 /100 | #288 | Tragic 6.9% |
| Immigrants | Dominica | 0.0 /100 | #289 | Tragic 6.9% |