Ute vs Immigrants from Latin America Male Poverty
COMPARE
Ute
Immigrants from Latin America
Male Poverty
Male Poverty Comparison
Ute
Immigrants from Latin America
16.2%
MALE POVERTY
0.0/ 100
METRIC RATING
331st/ 347
METRIC RANK
13.6%
MALE POVERTY
0.0/ 100
METRIC RATING
276th/ 347
METRIC RANK
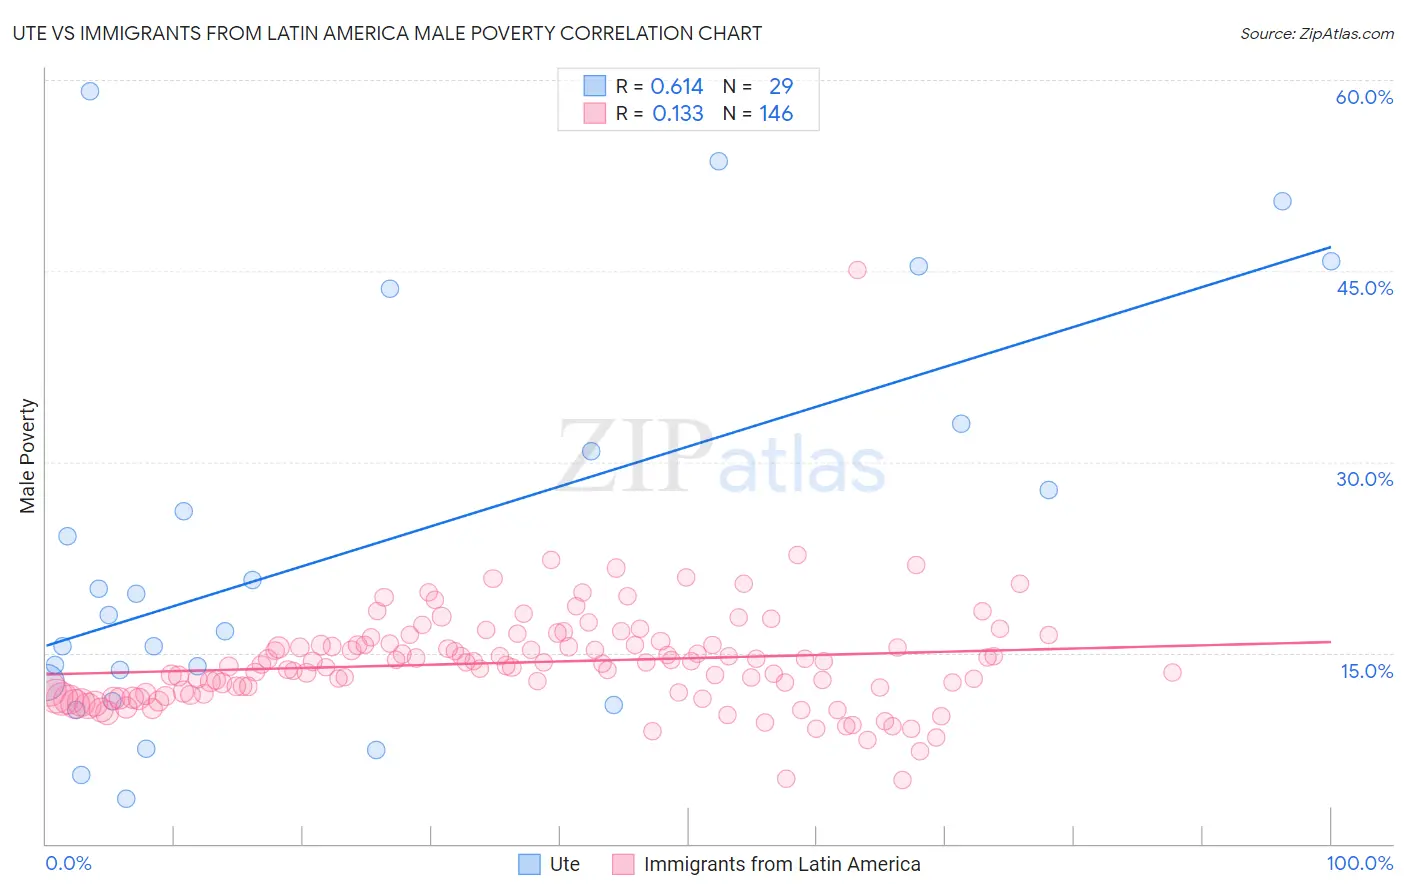
Ute vs Immigrants from Latin America Male Poverty Correlation Chart
The statistical analysis conducted on geographies consisting of 55,650,694 people shows a significant positive correlation between the proportion of Ute and poverty level among males in the United States with a correlation coefficient (R) of 0.614 and weighted average of 16.2%. Similarly, the statistical analysis conducted on geographies consisting of 557,334,914 people shows a poor positive correlation between the proportion of Immigrants from Latin America and poverty level among males in the United States with a correlation coefficient (R) of 0.133 and weighted average of 13.6%, a difference of 19.3%.
Male Poverty Correlation Summary
| Measurement | Ute | Immigrants from Latin America |
| Minimum | 3.5% | 5.0% |
| Maximum | 59.1% | 45.1% |
| Range | 55.6% | 40.1% |
| Mean | 23.3% | 14.2% |
| Median | 17.9% | 14.1% |
| Interquartile 25% (IQ1) | 12.0% | 11.8% |
| Interquartile 75% (IQ3) | 31.9% | 15.6% |
| Interquartile Range (IQR) | 20.0% | 3.9% |
| Standard Deviation (Sample) | 15.6% | 4.2% |
| Standard Deviation (Population) | 15.3% | 4.2% |
Similar Demographics by Male Poverty
Demographics Similar to Ute by Male Poverty
In terms of male poverty, the demographic groups most similar to Ute are Immigrants from Dominican Republic (16.2%, a difference of 0.34%), Dominican (16.1%, a difference of 0.99%), Black/African American (15.8%, a difference of 2.7%), Paiute (15.8%, a difference of 2.8%), and Houma (16.7%, a difference of 3.0%).
| Demographics | Rating | Rank | Male Poverty |
| Menominee | 0.0 /100 | #324 | Tragic 15.3% |
| Yakama | 0.0 /100 | #325 | Tragic 15.3% |
| Central American Indians | 0.0 /100 | #326 | Tragic 15.3% |
| Paiute | 0.0 /100 | #327 | Tragic 15.8% |
| Blacks/African Americans | 0.0 /100 | #328 | Tragic 15.8% |
| Dominicans | 0.0 /100 | #329 | Tragic 16.1% |
| Immigrants | Dominican Republic | 0.0 /100 | #330 | Tragic 16.2% |
| Ute | 0.0 /100 | #331 | Tragic 16.2% |
| Houma | 0.0 /100 | #332 | Tragic 16.7% |
| Natives/Alaskans | 0.0 /100 | #333 | Tragic 16.9% |
| Cheyenne | 0.0 /100 | #334 | Tragic 17.6% |
| Apache | 0.0 /100 | #335 | Tragic 17.7% |
| Pueblo | 0.0 /100 | #336 | Tragic 18.5% |
| Sioux | 0.0 /100 | #337 | Tragic 18.7% |
| Crow | 0.0 /100 | #338 | Tragic 19.1% |
Demographics Similar to Immigrants from Latin America by Male Poverty
In terms of male poverty, the demographic groups most similar to Immigrants from Latin America are Bangladeshi (13.6%, a difference of 0.15%), Barbadian (13.6%, a difference of 0.19%), Belizean (13.6%, a difference of 0.24%), Haitian (13.7%, a difference of 0.42%), and Mexican (13.7%, a difference of 0.52%).
| Demographics | Rating | Rank | Male Poverty |
| Guyanese | 0.0 /100 | #269 | Tragic 13.3% |
| Cree | 0.0 /100 | #270 | Tragic 13.3% |
| Spanish Americans | 0.0 /100 | #271 | Tragic 13.4% |
| Immigrants | Bahamas | 0.0 /100 | #272 | Tragic 13.5% |
| Chickasaw | 0.0 /100 | #273 | Tragic 13.5% |
| Immigrants | West Indies | 0.0 /100 | #274 | Tragic 13.5% |
| Barbadians | 0.0 /100 | #275 | Tragic 13.6% |
| Immigrants | Latin America | 0.0 /100 | #276 | Tragic 13.6% |
| Bangladeshis | 0.0 /100 | #277 | Tragic 13.6% |
| Belizeans | 0.0 /100 | #278 | Tragic 13.6% |
| Haitians | 0.0 /100 | #279 | Tragic 13.7% |
| Mexicans | 0.0 /100 | #280 | Tragic 13.7% |
| Yaqui | 0.0 /100 | #281 | Tragic 13.7% |
| Immigrants | Cabo Verde | 0.0 /100 | #282 | Tragic 13.7% |
| Comanche | 0.0 /100 | #283 | Tragic 13.8% |