Ute vs Immigrants from Latin America Single Father Households
COMPARE
Ute
Immigrants from Latin America
Single Father Households
Single Father Households Comparison
Ute
Immigrants from Latin America
3.0%
SINGLE FATHER HOUSEHOLDS
0.0/ 100
METRIC RATING
319th/ 347
METRIC RANK
2.8%
SINGLE FATHER HOUSEHOLDS
0.0/ 100
METRIC RATING
301st/ 347
METRIC RANK
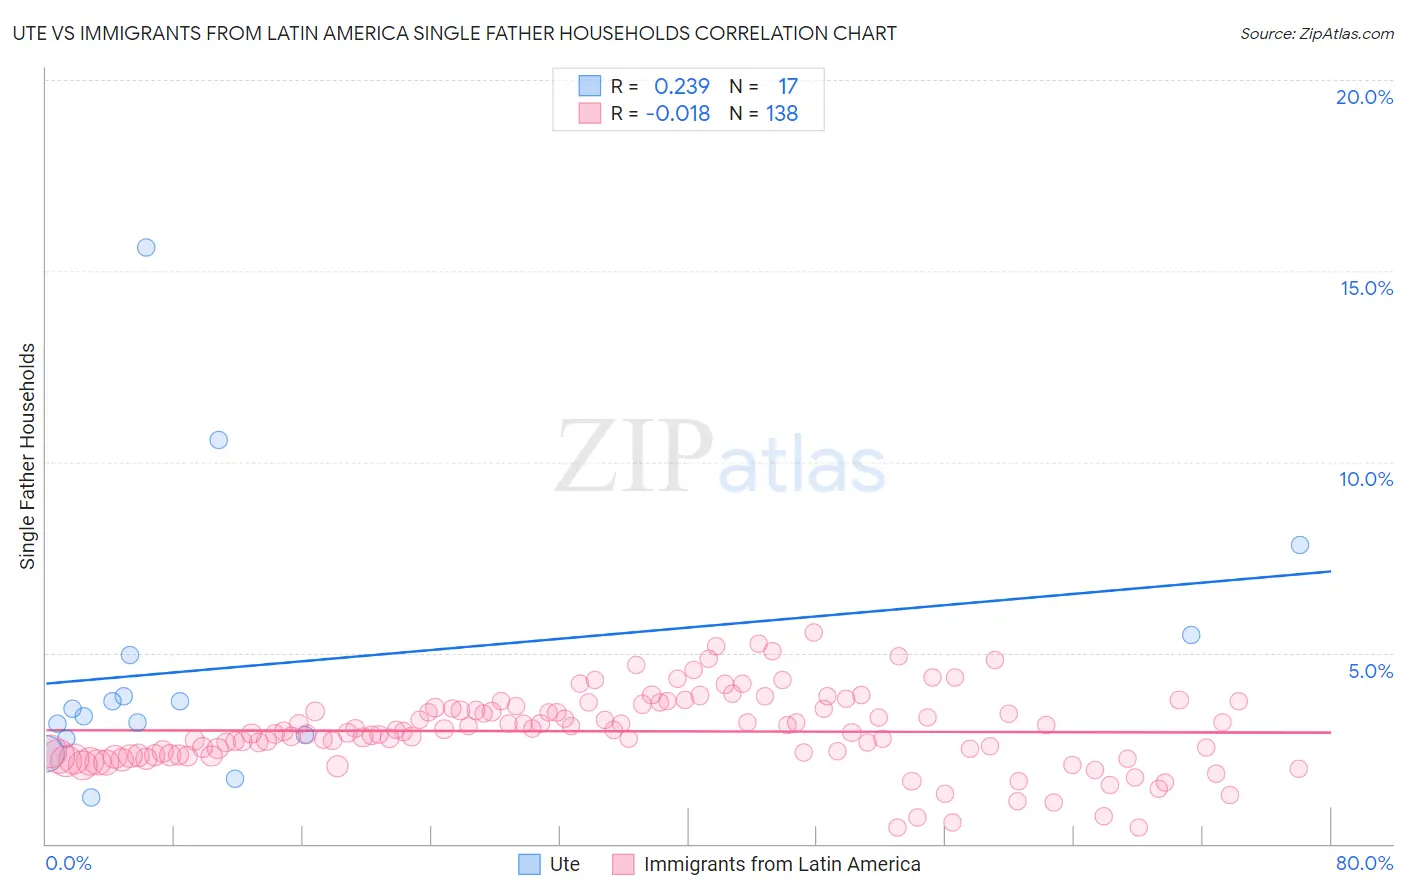
Ute vs Immigrants from Latin America Single Father Households Correlation Chart
The statistical analysis conducted on geographies consisting of 55,604,261 people shows a weak positive correlation between the proportion of Ute and percentage of single father households in the United States with a correlation coefficient (R) of 0.239 and weighted average of 3.0%. Similarly, the statistical analysis conducted on geographies consisting of 546,005,713 people shows no correlation between the proportion of Immigrants from Latin America and percentage of single father households in the United States with a correlation coefficient (R) of -0.018 and weighted average of 2.8%, a difference of 6.1%.
Single Father Households Correlation Summary
| Measurement | Ute | Immigrants from Latin America |
| Minimum | 1.2% | 0.41% |
| Maximum | 15.6% | 5.5% |
| Range | 14.4% | 5.1% |
| Mean | 4.7% | 2.9% |
| Median | 3.5% | 2.9% |
| Interquartile 25% (IQ1) | 2.8% | 2.3% |
| Interquartile 75% (IQ3) | 5.2% | 3.5% |
| Interquartile Range (IQR) | 2.4% | 1.2% |
| Standard Deviation (Sample) | 3.6% | 1.00% |
| Standard Deviation (Population) | 3.5% | 0.99% |
Demographics Similar to Ute and Immigrants from Latin America by Single Father Households
In terms of single father households, the demographic groups most similar to Ute are Guatemalan (3.0%, a difference of 0.080%), Cape Verdean (2.9%, a difference of 0.53%), Immigrants from El Salvador (2.9%, a difference of 0.54%), Cheyenne (2.9%, a difference of 1.4%), and Houma (2.9%, a difference of 1.4%). Similarly, the demographic groups most similar to Immigrants from Latin America are Kiowa (2.8%, a difference of 0.050%), Spanish American (2.8%, a difference of 0.53%), Immigrants from Honduras (2.8%, a difference of 0.55%), Mexican American Indian (2.8%, a difference of 0.87%), and Hispanic or Latino (2.8%, a difference of 1.0%).
| Demographics | Rating | Rank | Single Father Households |
| Kiowa | 0.0 /100 | #300 | Tragic 2.8% |
| Immigrants | Latin America | 0.0 /100 | #301 | Tragic 2.8% |
| Spanish Americans | 0.0 /100 | #302 | Tragic 2.8% |
| Immigrants | Honduras | 0.0 /100 | #303 | Tragic 2.8% |
| Mexican American Indians | 0.0 /100 | #304 | Tragic 2.8% |
| Hispanics or Latinos | 0.0 /100 | #305 | Tragic 2.8% |
| Immigrants | Azores | 0.0 /100 | #306 | Tragic 2.8% |
| Hopi | 0.0 /100 | #307 | Tragic 2.8% |
| Apache | 0.0 /100 | #308 | Tragic 2.8% |
| Central Americans | 0.0 /100 | #309 | Tragic 2.9% |
| Immigrants | Laos | 0.0 /100 | #310 | Tragic 2.9% |
| Spanish American Indians | 0.0 /100 | #311 | Tragic 2.9% |
| Tsimshian | 0.0 /100 | #312 | Tragic 2.9% |
| Arapaho | 0.0 /100 | #313 | Tragic 2.9% |
| Salvadorans | 0.0 /100 | #314 | Tragic 2.9% |
| Cheyenne | 0.0 /100 | #315 | Tragic 2.9% |
| Houma | 0.0 /100 | #316 | Tragic 2.9% |
| Immigrants | El Salvador | 0.0 /100 | #317 | Tragic 2.9% |
| Cape Verdeans | 0.0 /100 | #318 | Tragic 2.9% |
| Ute | 0.0 /100 | #319 | Tragic 3.0% |
| Guatemalans | 0.0 /100 | #320 | Tragic 3.0% |