Ute vs Immigrants from Denmark Ambulatory Disability
COMPARE
Ute
Immigrants from Denmark
Ambulatory Disability
Ambulatory Disability Comparison
Ute
Immigrants from Denmark
6.0%
AMBULATORY DISABILITY
86.6/ 100
METRIC RATING
134th/ 347
METRIC RANK
5.8%
AMBULATORY DISABILITY
98.6/ 100
METRIC RATING
93rd/ 347
METRIC RANK
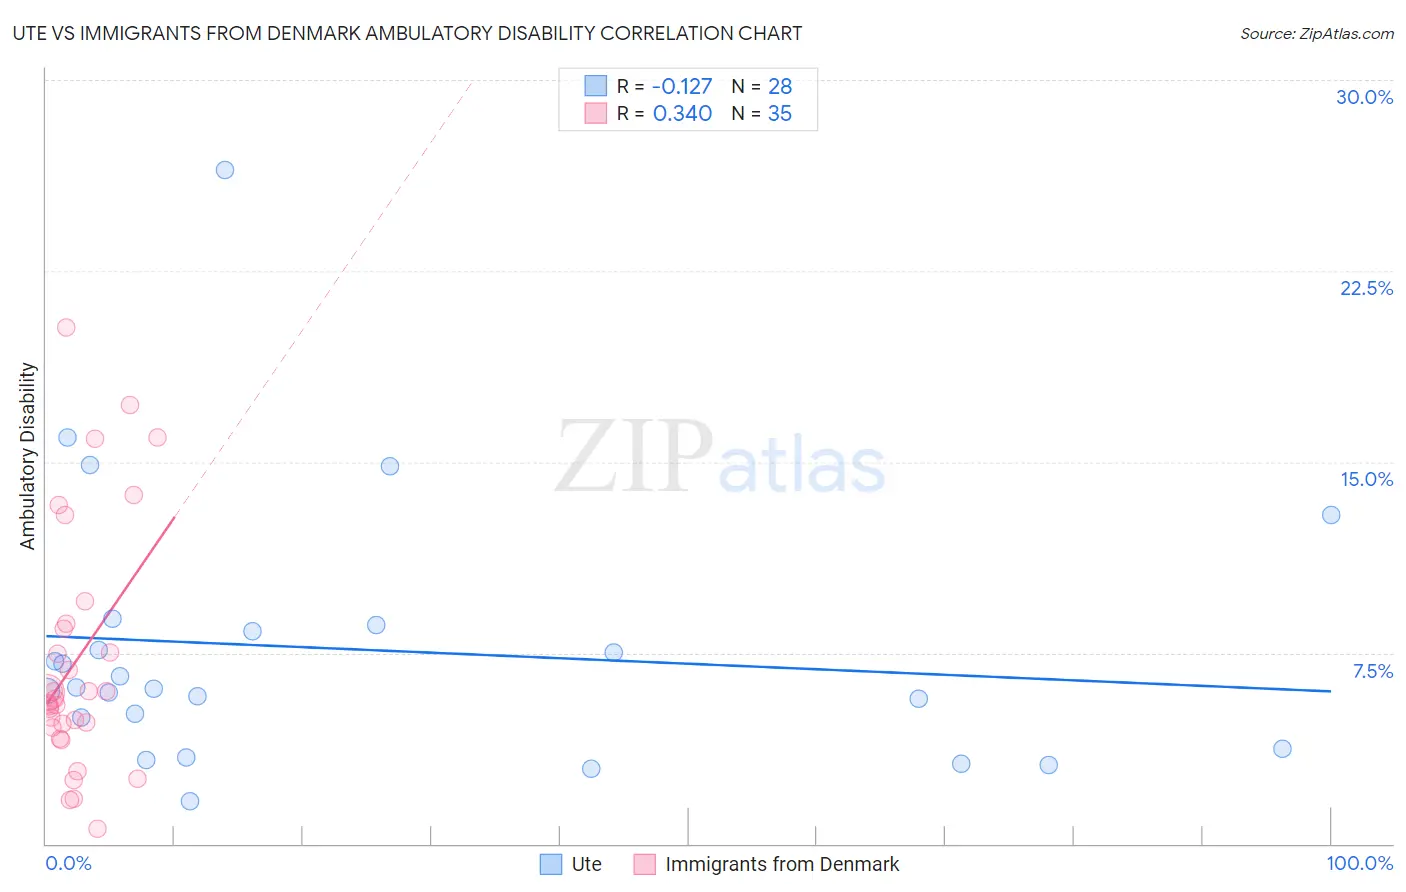
Ute vs Immigrants from Denmark Ambulatory Disability Correlation Chart
The statistical analysis conducted on geographies consisting of 55,667,207 people shows a poor negative correlation between the proportion of Ute and percentage of population with ambulatory disability in the United States with a correlation coefficient (R) of -0.127 and weighted average of 6.0%. Similarly, the statistical analysis conducted on geographies consisting of 136,424,948 people shows a mild positive correlation between the proportion of Immigrants from Denmark and percentage of population with ambulatory disability in the United States with a correlation coefficient (R) of 0.340 and weighted average of 5.8%, a difference of 3.4%.
Ambulatory Disability Correlation Summary
| Measurement | Ute | Immigrants from Denmark |
| Minimum | 1.7% | 0.61% |
| Maximum | 26.5% | 20.3% |
| Range | 24.8% | 19.6% |
| Mean | 7.6% | 7.2% |
| Median | 6.1% | 5.7% |
| Interquartile 25% (IQ1) | 4.3% | 4.6% |
| Interquartile 75% (IQ3) | 8.5% | 8.7% |
| Interquartile Range (IQR) | 4.1% | 4.1% |
| Standard Deviation (Sample) | 5.2% | 4.8% |
| Standard Deviation (Population) | 5.1% | 4.7% |
Similar Demographics by Ambulatory Disability
Demographics Similar to Ute by Ambulatory Disability
In terms of ambulatory disability, the demographic groups most similar to Ute are Immigrants (6.0%, a difference of 0.040%), Immigrants from Europe (6.0%, a difference of 0.15%), Immigrants from Italy (6.0%, a difference of 0.18%), Immigrants from North Macedonia (6.0%, a difference of 0.27%), and Immigrants from Syria (6.0%, a difference of 0.27%).
| Demographics | Rating | Rank | Ambulatory Disability |
| Immigrants | Nigeria | 90.9 /100 | #127 | Exceptional 5.9% |
| Immigrants | Western Asia | 90.7 /100 | #128 | Exceptional 5.9% |
| Immigrants | Norway | 90.5 /100 | #129 | Exceptional 5.9% |
| Immigrants | Kazakhstan | 89.7 /100 | #130 | Excellent 5.9% |
| Immigrants | Costa Rica | 89.5 /100 | #131 | Excellent 5.9% |
| Immigrants | Europe | 87.8 /100 | #132 | Excellent 6.0% |
| Immigrants | Immigrants | 86.9 /100 | #133 | Excellent 6.0% |
| Ute | 86.6 /100 | #134 | Excellent 6.0% |
| Immigrants | Italy | 85.0 /100 | #135 | Excellent 6.0% |
| Immigrants | North Macedonia | 84.1 /100 | #136 | Excellent 6.0% |
| Immigrants | Syria | 84.1 /100 | #137 | Excellent 6.0% |
| Immigrants | Hungary | 83.9 /100 | #138 | Excellent 6.0% |
| Immigrants | Zaire | 83.6 /100 | #139 | Excellent 6.0% |
| Czechs | 83.3 /100 | #140 | Excellent 6.0% |
| Swedes | 83.1 /100 | #141 | Excellent 6.0% |
Demographics Similar to Immigrants from Denmark by Ambulatory Disability
In terms of ambulatory disability, the demographic groups most similar to Immigrants from Denmark are Immigrants from Sierra Leone (5.8%, a difference of 0.010%), Immigrants from Sudan (5.8%, a difference of 0.17%), Bhutanese (5.8%, a difference of 0.18%), Australian (5.8%, a difference of 0.18%), and Kenyan (5.8%, a difference of 0.19%).
| Demographics | Rating | Rank | Ambulatory Disability |
| Latvians | 99.0 /100 | #86 | Exceptional 5.7% |
| Immigrants | Chile | 98.9 /100 | #87 | Exceptional 5.8% |
| Soviet Union | 98.9 /100 | #88 | Exceptional 5.8% |
| Bhutanese | 98.8 /100 | #89 | Exceptional 5.8% |
| Australians | 98.8 /100 | #90 | Exceptional 5.8% |
| Immigrants | Sudan | 98.8 /100 | #91 | Exceptional 5.8% |
| Immigrants | Sierra Leone | 98.6 /100 | #92 | Exceptional 5.8% |
| Immigrants | Denmark | 98.6 /100 | #93 | Exceptional 5.8% |
| Kenyans | 98.4 /100 | #94 | Exceptional 5.8% |
| Immigrants | El Salvador | 98.4 /100 | #95 | Exceptional 5.8% |
| Salvadorans | 98.4 /100 | #96 | Exceptional 5.8% |
| Immigrants | Somalia | 98.3 /100 | #97 | Exceptional 5.8% |
| Immigrants | Lebanon | 98.3 /100 | #98 | Exceptional 5.8% |
| Immigrants | Northern Europe | 98.2 /100 | #99 | Exceptional 5.8% |
| Immigrants | Serbia | 97.9 /100 | #100 | Exceptional 5.8% |