Uruguayan vs Immigrants from Latin America Ambulatory Disability
COMPARE
Uruguayan
Immigrants from Latin America
Ambulatory Disability
Ambulatory Disability Comparison
Uruguayans
Immigrants from Latin America
5.8%
AMBULATORY DISABILITY
97.2/ 100
METRIC RATING
107th/ 347
METRIC RANK
6.3%
AMBULATORY DISABILITY
11.0/ 100
METRIC RATING
215th/ 347
METRIC RANK
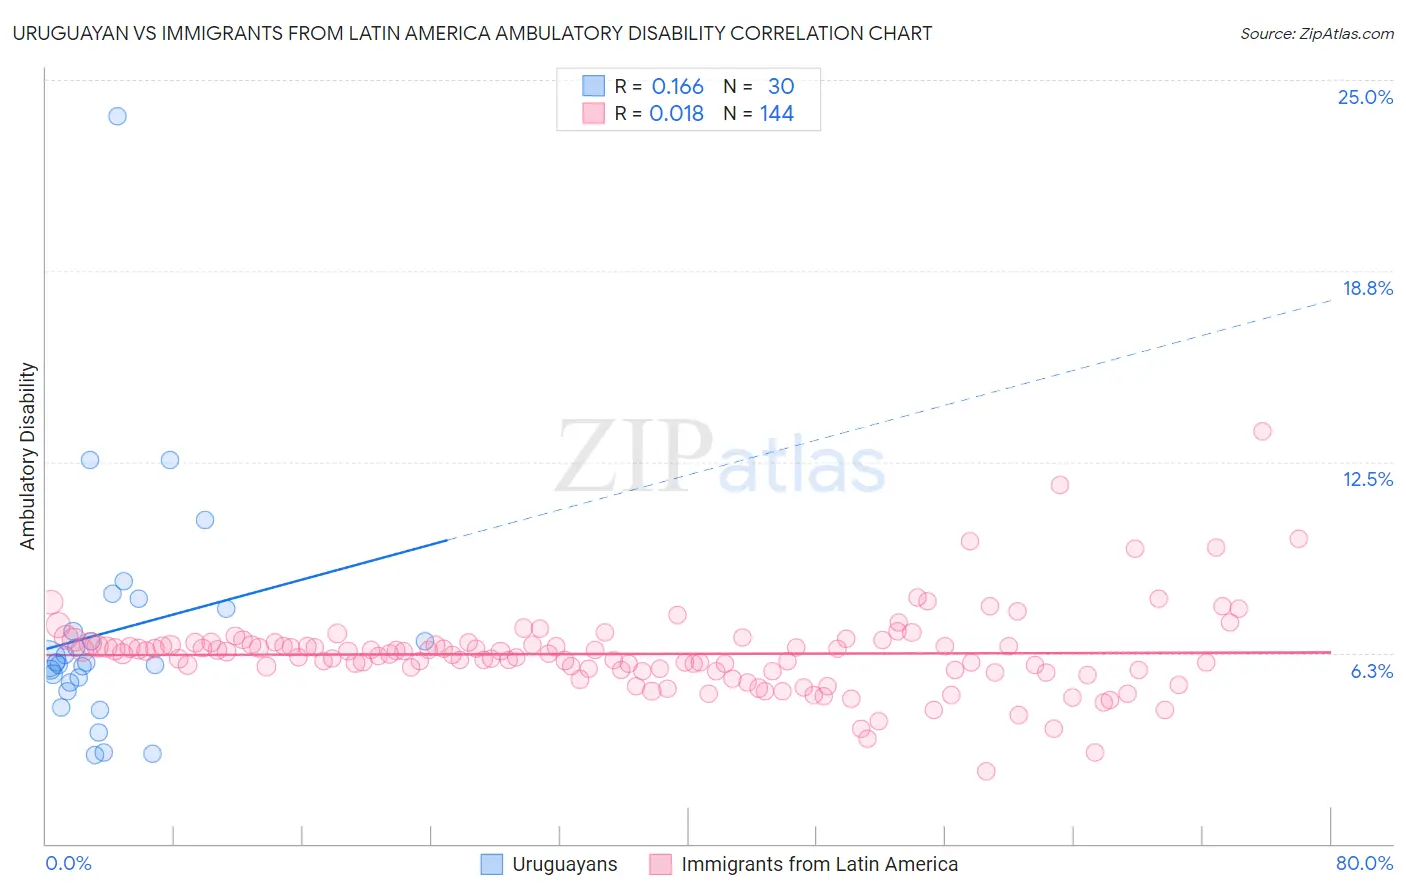
Uruguayan vs Immigrants from Latin America Ambulatory Disability Correlation Chart
The statistical analysis conducted on geographies consisting of 144,780,979 people shows a poor positive correlation between the proportion of Uruguayans and percentage of population with ambulatory disability in the United States with a correlation coefficient (R) of 0.166 and weighted average of 5.8%. Similarly, the statistical analysis conducted on geographies consisting of 558,117,601 people shows no correlation between the proportion of Immigrants from Latin America and percentage of population with ambulatory disability in the United States with a correlation coefficient (R) of 0.018 and weighted average of 6.3%, a difference of 7.8%.
Ambulatory Disability Correlation Summary
| Measurement | Uruguayan | Immigrants from Latin America |
| Minimum | 2.9% | 2.4% |
| Maximum | 23.8% | 13.5% |
| Range | 20.9% | 11.1% |
| Mean | 6.9% | 6.2% |
| Median | 5.9% | 6.2% |
| Interquartile 25% (IQ1) | 5.3% | 5.7% |
| Interquartile 75% (IQ3) | 7.7% | 6.5% |
| Interquartile Range (IQR) | 2.4% | 0.86% |
| Standard Deviation (Sample) | 4.0% | 1.4% |
| Standard Deviation (Population) | 3.9% | 1.4% |
Similar Demographics by Ambulatory Disability
Demographics Similar to Uruguayans by Ambulatory Disability
In terms of ambulatory disability, the demographic groups most similar to Uruguayans are Colombian (5.8%, a difference of 0.010%), Immigrants from Netherlands (5.8%, a difference of 0.030%), Immigrants from Morocco (5.8%, a difference of 0.050%), Immigrants from Czechoslovakia (5.8%, a difference of 0.12%), and Immigrants from Colombia (5.8%, a difference of 0.21%).
| Demographics | Rating | Rank | Ambulatory Disability |
| Immigrants | Serbia | 97.9 /100 | #100 | Exceptional 5.8% |
| Immigrants | South America | 97.9 /100 | #101 | Exceptional 5.8% |
| Immigrants | Kenya | 97.8 /100 | #102 | Exceptional 5.8% |
| Immigrants | Romania | 97.7 /100 | #103 | Exceptional 5.8% |
| New Zealanders | 97.6 /100 | #104 | Exceptional 5.8% |
| Immigrants | Czechoslovakia | 97.4 /100 | #105 | Exceptional 5.8% |
| Immigrants | Morocco | 97.3 /100 | #106 | Exceptional 5.8% |
| Uruguayans | 97.2 /100 | #107 | Exceptional 5.8% |
| Colombians | 97.2 /100 | #108 | Exceptional 5.8% |
| Immigrants | Netherlands | 97.1 /100 | #109 | Exceptional 5.8% |
| Immigrants | Colombia | 96.7 /100 | #110 | Exceptional 5.8% |
| Danes | 96.6 /100 | #111 | Exceptional 5.8% |
| South Africans | 96.3 /100 | #112 | Exceptional 5.9% |
| Immigrants | Uruguay | 95.6 /100 | #113 | Exceptional 5.9% |
| Immigrants | Poland | 95.4 /100 | #114 | Exceptional 5.9% |
Demographics Similar to Immigrants from Latin America by Ambulatory Disability
In terms of ambulatory disability, the demographic groups most similar to Immigrants from Latin America are Immigrants from Mexico (6.3%, a difference of 0.010%), Canadian (6.3%, a difference of 0.010%), Yugoslavian (6.3%, a difference of 0.010%), Guamanian/Chamorro (6.3%, a difference of 0.050%), and Mexican American Indian (6.3%, a difference of 0.13%).
| Demographics | Rating | Rank | Ambulatory Disability |
| Bangladeshis | 14.2 /100 | #208 | Poor 6.3% |
| Immigrants | Iraq | 14.0 /100 | #209 | Poor 6.3% |
| Immigrants | Laos | 13.2 /100 | #210 | Poor 6.3% |
| Samoans | 12.1 /100 | #211 | Poor 6.3% |
| Mexican American Indians | 12.0 /100 | #212 | Poor 6.3% |
| Japanese | 12.0 /100 | #213 | Poor 6.3% |
| Immigrants | Mexico | 11.0 /100 | #214 | Poor 6.3% |
| Immigrants | Latin America | 11.0 /100 | #215 | Poor 6.3% |
| Canadians | 10.9 /100 | #216 | Poor 6.3% |
| Yugoslavians | 10.9 /100 | #217 | Poor 6.3% |
| Guamanians/Chamorros | 10.6 /100 | #218 | Poor 6.3% |
| Indonesians | 9.9 /100 | #219 | Tragic 6.3% |
| Immigrants | Albania | 9.6 /100 | #220 | Tragic 6.3% |
| Hungarians | 9.6 /100 | #221 | Tragic 6.3% |
| German Russians | 9.4 /100 | #222 | Tragic 6.3% |