U.S. Virgin Islander vs Jordanian Disability Age 5 to 17
COMPARE
U.S. Virgin Islander
Jordanian
Disability Age 5 to 17
Disability Age 5 to 17 Comparison
U.S. Virgin Islanders
Jordanians
6.3%
DISABILITY AGE 5 TO 17
0.0/ 100
METRIC RATING
301st/ 347
METRIC RANK
5.2%
DISABILITY AGE 5 TO 17
99.7/ 100
METRIC RATING
71st/ 347
METRIC RANK
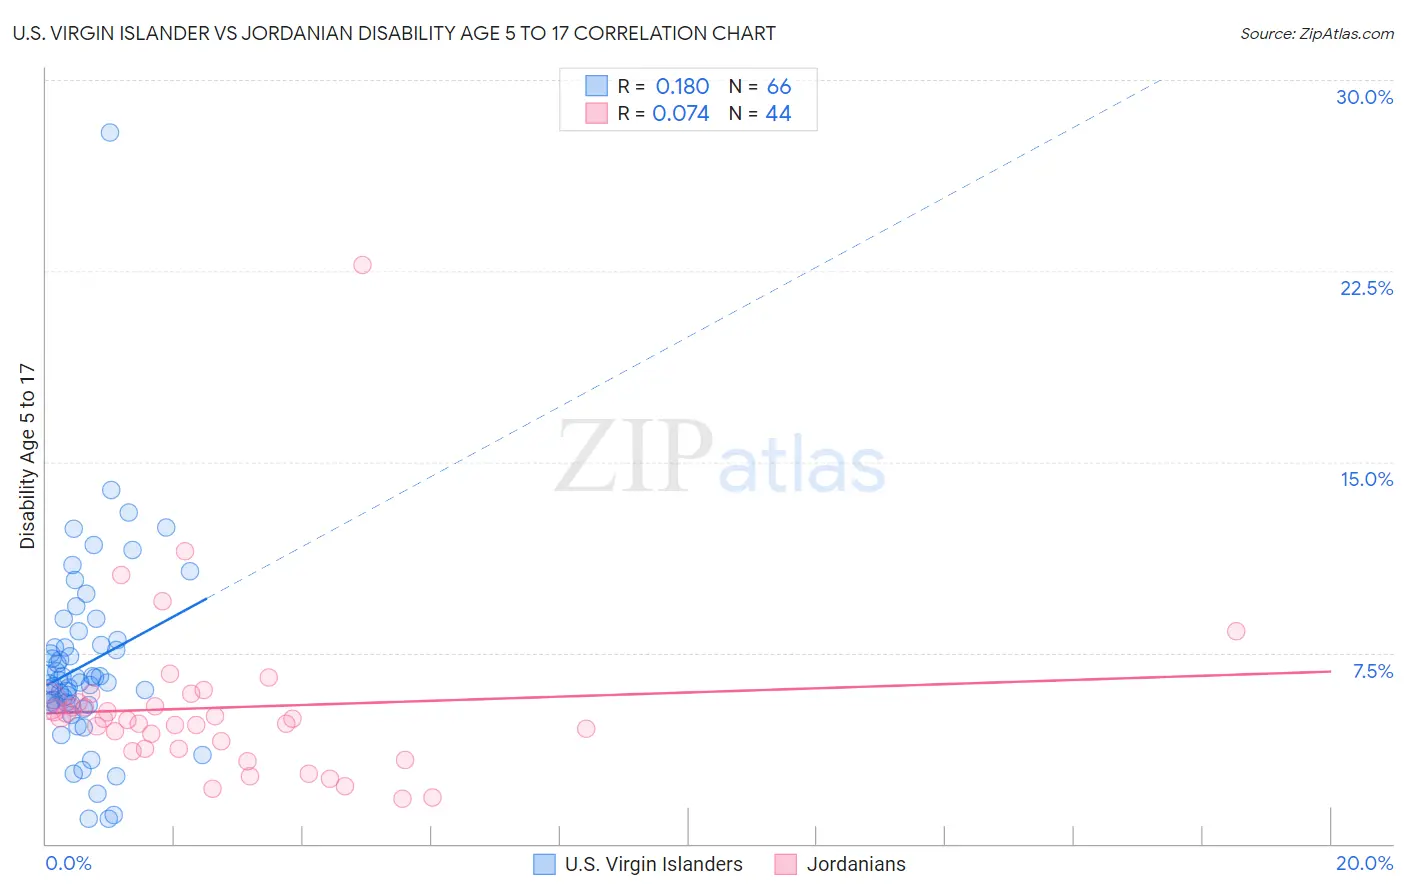
U.S. Virgin Islander vs Jordanian Disability Age 5 to 17 Correlation Chart
The statistical analysis conducted on geographies consisting of 87,363,658 people shows a poor positive correlation between the proportion of U.S. Virgin Islanders and percentage of population with a disability between the ages 5 and 17 in the United States with a correlation coefficient (R) of 0.180 and weighted average of 6.3%. Similarly, the statistical analysis conducted on geographies consisting of 165,912,846 people shows a slight positive correlation between the proportion of Jordanians and percentage of population with a disability between the ages 5 and 17 in the United States with a correlation coefficient (R) of 0.074 and weighted average of 5.2%, a difference of 20.5%.
Disability Age 5 to 17 Correlation Summary
| Measurement | U.S. Virgin Islander | Jordanian |
| Minimum | 0.97% | 1.8% |
| Maximum | 27.9% | 22.7% |
| Range | 27.0% | 20.9% |
| Mean | 7.0% | 5.3% |
| Median | 6.4% | 4.9% |
| Interquartile 25% (IQ1) | 5.5% | 3.7% |
| Interquartile 75% (IQ3) | 7.8% | 5.6% |
| Interquartile Range (IQR) | 2.3% | 1.9% |
| Standard Deviation (Sample) | 3.8% | 3.4% |
| Standard Deviation (Population) | 3.8% | 3.3% |
Similar Demographics by Disability Age 5 to 17
Demographics Similar to U.S. Virgin Islanders by Disability Age 5 to 17
In terms of disability age 5 to 17, the demographic groups most similar to U.S. Virgin Islanders are Carpatho Rusyn (6.3%, a difference of 0.020%), Welsh (6.3%, a difference of 0.14%), Lumbee (6.2%, a difference of 0.29%), Celtic (6.3%, a difference of 0.33%), and Immigrants from Bahamas (6.2%, a difference of 0.36%).
| Demographics | Rating | Rank | Disability Age 5 to 17 |
| Irish | 0.0 /100 | #294 | Tragic 6.2% |
| Cree | 0.0 /100 | #295 | Tragic 6.2% |
| Spanish Americans | 0.0 /100 | #296 | Tragic 6.2% |
| Immigrants | Bahamas | 0.0 /100 | #297 | Tragic 6.2% |
| Lumbee | 0.0 /100 | #298 | Tragic 6.2% |
| Welsh | 0.0 /100 | #299 | Tragic 6.3% |
| Carpatho Rusyns | 0.0 /100 | #300 | Tragic 6.3% |
| U.S. Virgin Islanders | 0.0 /100 | #301 | Tragic 6.3% |
| Celtics | 0.0 /100 | #302 | Tragic 6.3% |
| Yakama | 0.0 /100 | #303 | Tragic 6.3% |
| Senegalese | 0.0 /100 | #304 | Tragic 6.3% |
| Natives/Alaskans | 0.0 /100 | #305 | Tragic 6.3% |
| Immigrants | Nonimmigrants | 0.0 /100 | #306 | Tragic 6.3% |
| Bahamians | 0.0 /100 | #307 | Tragic 6.3% |
| Scotch-Irish | 0.0 /100 | #308 | Tragic 6.3% |
Demographics Similar to Jordanians by Disability Age 5 to 17
In terms of disability age 5 to 17, the demographic groups most similar to Jordanians are Immigrants from Vietnam (5.2%, a difference of 0.020%), Immigrants from Belgium (5.2%, a difference of 0.050%), Immigrants from Czechoslovakia (5.2%, a difference of 0.050%), Guyanese (5.2%, a difference of 0.080%), and Immigrants from Romania (5.2%, a difference of 0.12%).
| Demographics | Rating | Rank | Disability Age 5 to 17 |
| Immigrants | South Eastern Asia | 99.8 /100 | #64 | Exceptional 5.2% |
| Immigrants | Greece | 99.8 /100 | #65 | Exceptional 5.2% |
| Palestinians | 99.8 /100 | #66 | Exceptional 5.2% |
| Macedonians | 99.8 /100 | #67 | Exceptional 5.2% |
| Immigrants | Syria | 99.7 /100 | #68 | Exceptional 5.2% |
| Guyanese | 99.7 /100 | #69 | Exceptional 5.2% |
| Immigrants | Belgium | 99.7 /100 | #70 | Exceptional 5.2% |
| Jordanians | 99.7 /100 | #71 | Exceptional 5.2% |
| Immigrants | Vietnam | 99.7 /100 | #72 | Exceptional 5.2% |
| Immigrants | Czechoslovakia | 99.7 /100 | #73 | Exceptional 5.2% |
| Immigrants | Romania | 99.7 /100 | #74 | Exceptional 5.2% |
| Immigrants | Moldova | 99.6 /100 | #75 | Exceptional 5.2% |
| Immigrants | Guyana | 99.6 /100 | #76 | Exceptional 5.2% |
| Immigrants | Kazakhstan | 99.6 /100 | #77 | Exceptional 5.2% |
| Immigrants | Cuba | 99.6 /100 | #78 | Exceptional 5.2% |