U.S. Virgin Islander vs Jordanian In Labor Force | Age 45-54
COMPARE
U.S. Virgin Islander
Jordanian
In Labor Force | Age 45-54
In Labor Force | Age 45-54 Comparison
U.S. Virgin Islanders
Jordanians
81.2%
IN LABOR FORCE | AGE 45-54
0.0/ 100
METRIC RATING
276th/ 347
METRIC RANK
83.4%
IN LABOR FORCE | AGE 45-54
96.4/ 100
METRIC RATING
81st/ 347
METRIC RANK
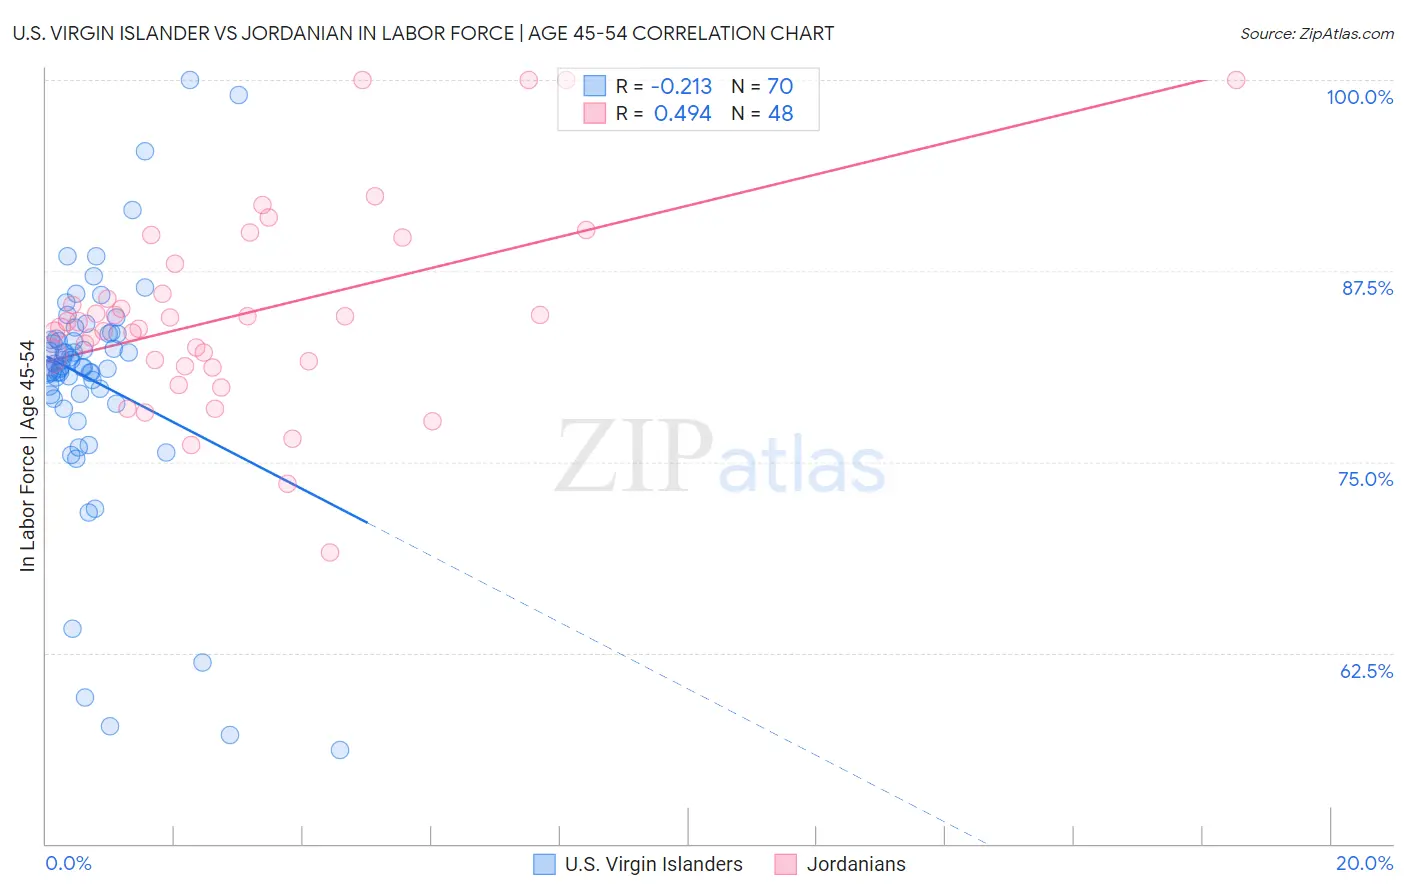
U.S. Virgin Islander vs Jordanian In Labor Force | Age 45-54 Correlation Chart
The statistical analysis conducted on geographies consisting of 87,510,116 people shows a weak negative correlation between the proportion of U.S. Virgin Islanders and labor force participation rate among population between the ages 45 and 54 in the United States with a correlation coefficient (R) of -0.213 and weighted average of 81.2%. Similarly, the statistical analysis conducted on geographies consisting of 166,384,997 people shows a moderate positive correlation between the proportion of Jordanians and labor force participation rate among population between the ages 45 and 54 in the United States with a correlation coefficient (R) of 0.494 and weighted average of 83.4%, a difference of 2.7%.
In Labor Force | Age 45-54 Correlation Summary
| Measurement | U.S. Virgin Islander | Jordanian |
| Minimum | 56.1% | 69.1% |
| Maximum | 100.0% | 100.0% |
| Range | 43.9% | 30.9% |
| Mean | 80.3% | 84.7% |
| Median | 81.2% | 84.0% |
| Interquartile 25% (IQ1) | 79.4% | 81.5% |
| Interquartile 75% (IQ3) | 83.4% | 87.0% |
| Interquartile Range (IQR) | 4.0% | 5.6% |
| Standard Deviation (Sample) | 8.1% | 6.5% |
| Standard Deviation (Population) | 8.0% | 6.5% |
Similar Demographics by In Labor Force | Age 45-54
Demographics Similar to U.S. Virgin Islanders by In Labor Force | Age 45-54
In terms of in labor force | age 45-54, the demographic groups most similar to U.S. Virgin Islanders are Guatemalan (81.2%, a difference of 0.020%), Nonimmigrants (81.2%, a difference of 0.040%), British West Indian (81.2%, a difference of 0.050%), Chippewa (81.3%, a difference of 0.090%), and Immigrants from Guatemala (81.1%, a difference of 0.10%).
| Demographics | Rating | Rank | In Labor Force | Age 45-54 |
| Alsatians | 0.0 /100 | #269 | Tragic 81.3% |
| Bangladeshis | 0.0 /100 | #270 | Tragic 81.3% |
| Immigrants | Barbados | 0.0 /100 | #271 | Tragic 81.3% |
| Spanish | 0.0 /100 | #272 | Tragic 81.3% |
| Chippewa | 0.0 /100 | #273 | Tragic 81.3% |
| British West Indians | 0.0 /100 | #274 | Tragic 81.2% |
| Immigrants | Nonimmigrants | 0.0 /100 | #275 | Tragic 81.2% |
| U.S. Virgin Islanders | 0.0 /100 | #276 | Tragic 81.2% |
| Guatemalans | 0.0 /100 | #277 | Tragic 81.2% |
| Immigrants | Guatemala | 0.0 /100 | #278 | Tragic 81.1% |
| Immigrants | Micronesia | 0.0 /100 | #279 | Tragic 81.1% |
| Immigrants | Latin America | 0.0 /100 | #280 | Tragic 81.0% |
| Immigrants | Grenada | 0.0 /100 | #281 | Tragic 81.0% |
| Aleuts | 0.0 /100 | #282 | Tragic 81.0% |
| French American Indians | 0.0 /100 | #283 | Tragic 80.8% |
Demographics Similar to Jordanians by In Labor Force | Age 45-54
In terms of in labor force | age 45-54, the demographic groups most similar to Jordanians are Immigrants from Croatia (83.4%, a difference of 0.0%), Immigrants from Egypt (83.4%, a difference of 0.010%), Belgian (83.4%, a difference of 0.010%), Immigrants from Eastern Asia (83.4%, a difference of 0.010%), and Immigrants from Zimbabwe (83.4%, a difference of 0.010%).
| Demographics | Rating | Rank | In Labor Force | Age 45-54 |
| Immigrants | Somalia | 96.9 /100 | #74 | Exceptional 83.4% |
| Estonians | 96.9 /100 | #75 | Exceptional 83.4% |
| Russians | 96.8 /100 | #76 | Exceptional 83.4% |
| Cubans | 96.7 /100 | #77 | Exceptional 83.4% |
| Immigrants | Egypt | 96.6 /100 | #78 | Exceptional 83.4% |
| Belgians | 96.5 /100 | #79 | Exceptional 83.4% |
| Immigrants | Croatia | 96.5 /100 | #80 | Exceptional 83.4% |
| Jordanians | 96.4 /100 | #81 | Exceptional 83.4% |
| Immigrants | Eastern Asia | 96.3 /100 | #82 | Exceptional 83.4% |
| Immigrants | Zimbabwe | 96.3 /100 | #83 | Exceptional 83.4% |
| Immigrants | Bosnia and Herzegovina | 96.0 /100 | #84 | Exceptional 83.3% |
| Greeks | 95.9 /100 | #85 | Exceptional 83.3% |
| Immigrants | Northern Africa | 95.7 /100 | #86 | Exceptional 83.3% |
| Immigrants | Eastern Europe | 95.6 /100 | #87 | Exceptional 83.3% |
| Immigrants | Asia | 95.6 /100 | #88 | Exceptional 83.3% |