U.S. Virgin Islander vs Immigrants from Caribbean Disability Age 5 to 17
COMPARE
U.S. Virgin Islander
Immigrants from Caribbean
Disability Age 5 to 17
Disability Age 5 to 17 Comparison
U.S. Virgin Islanders
Immigrants from Caribbean
6.3%
DISABILITY AGE 5 TO 17
0.0/ 100
METRIC RATING
301st/ 347
METRIC RANK
5.9%
DISABILITY AGE 5 TO 17
2.1/ 100
METRIC RATING
241st/ 347
METRIC RANK
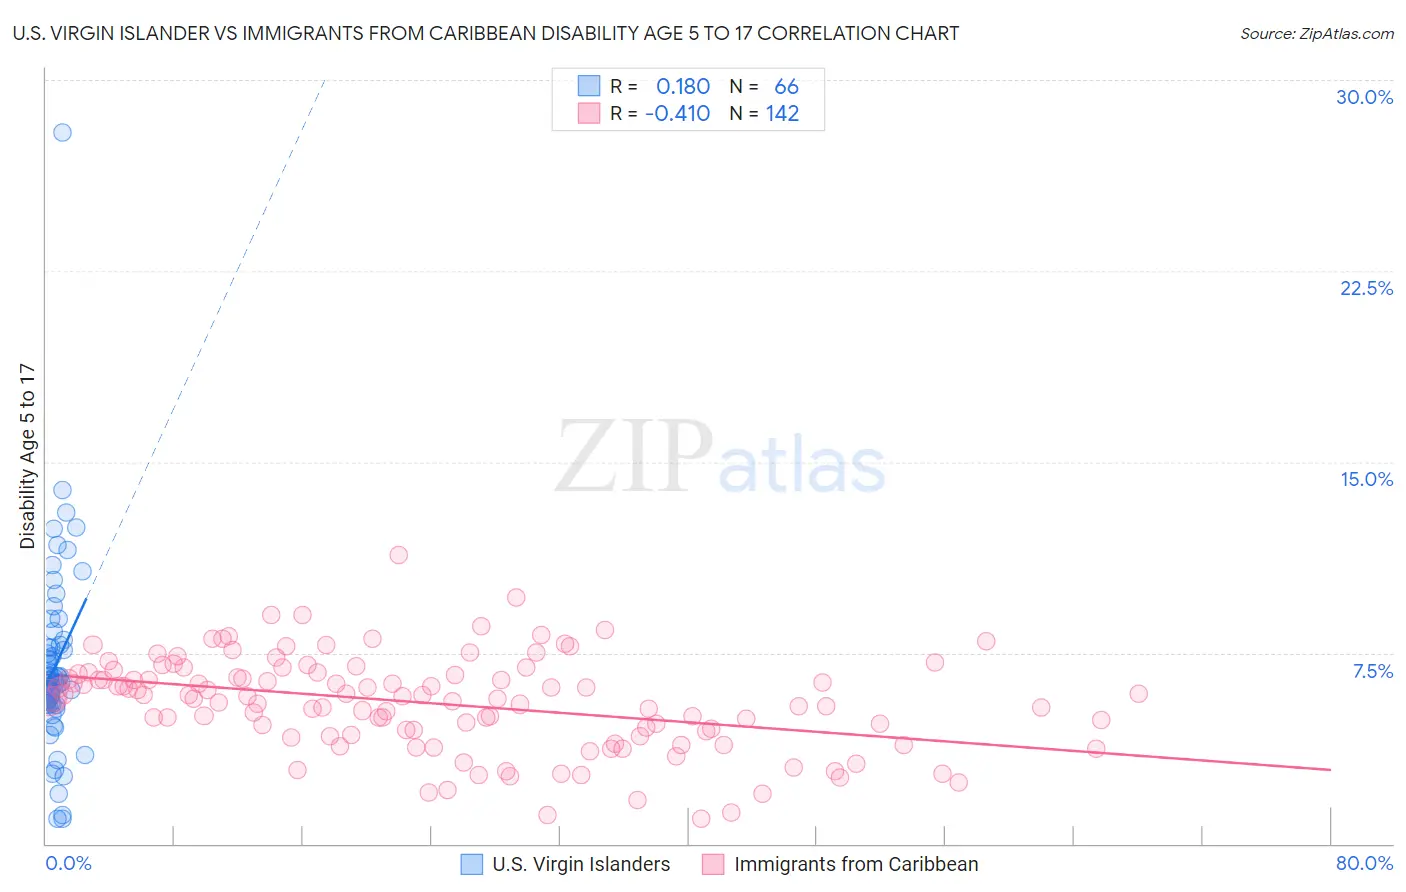
U.S. Virgin Islander vs Immigrants from Caribbean Disability Age 5 to 17 Correlation Chart
The statistical analysis conducted on geographies consisting of 87,363,658 people shows a poor positive correlation between the proportion of U.S. Virgin Islanders and percentage of population with a disability between the ages 5 and 17 in the United States with a correlation coefficient (R) of 0.180 and weighted average of 6.3%. Similarly, the statistical analysis conducted on geographies consisting of 445,217,348 people shows a moderate negative correlation between the proportion of Immigrants from Caribbean and percentage of population with a disability between the ages 5 and 17 in the United States with a correlation coefficient (R) of -0.410 and weighted average of 5.9%, a difference of 6.8%.
Disability Age 5 to 17 Correlation Summary
| Measurement | U.S. Virgin Islander | Immigrants from Caribbean |
| Minimum | 0.97% | 1.0% |
| Maximum | 27.9% | 11.3% |
| Range | 27.0% | 10.3% |
| Mean | 7.0% | 5.5% |
| Median | 6.4% | 5.7% |
| Interquartile 25% (IQ1) | 5.5% | 4.3% |
| Interquartile 75% (IQ3) | 7.8% | 6.7% |
| Interquartile Range (IQR) | 2.3% | 2.4% |
| Standard Deviation (Sample) | 3.8% | 1.9% |
| Standard Deviation (Population) | 3.8% | 1.8% |
Similar Demographics by Disability Age 5 to 17
Demographics Similar to U.S. Virgin Islanders by Disability Age 5 to 17
In terms of disability age 5 to 17, the demographic groups most similar to U.S. Virgin Islanders are Carpatho Rusyn (6.3%, a difference of 0.020%), Welsh (6.3%, a difference of 0.14%), Lumbee (6.2%, a difference of 0.29%), Celtic (6.3%, a difference of 0.33%), and Immigrants from Bahamas (6.2%, a difference of 0.36%).
| Demographics | Rating | Rank | Disability Age 5 to 17 |
| Irish | 0.0 /100 | #294 | Tragic 6.2% |
| Cree | 0.0 /100 | #295 | Tragic 6.2% |
| Spanish Americans | 0.0 /100 | #296 | Tragic 6.2% |
| Immigrants | Bahamas | 0.0 /100 | #297 | Tragic 6.2% |
| Lumbee | 0.0 /100 | #298 | Tragic 6.2% |
| Welsh | 0.0 /100 | #299 | Tragic 6.3% |
| Carpatho Rusyns | 0.0 /100 | #300 | Tragic 6.3% |
| U.S. Virgin Islanders | 0.0 /100 | #301 | Tragic 6.3% |
| Celtics | 0.0 /100 | #302 | Tragic 6.3% |
| Yakama | 0.0 /100 | #303 | Tragic 6.3% |
| Senegalese | 0.0 /100 | #304 | Tragic 6.3% |
| Natives/Alaskans | 0.0 /100 | #305 | Tragic 6.3% |
| Immigrants | Nonimmigrants | 0.0 /100 | #306 | Tragic 6.3% |
| Bahamians | 0.0 /100 | #307 | Tragic 6.3% |
| Scotch-Irish | 0.0 /100 | #308 | Tragic 6.3% |
Demographics Similar to Immigrants from Caribbean by Disability Age 5 to 17
In terms of disability age 5 to 17, the demographic groups most similar to Immigrants from Caribbean are Spaniard (5.9%, a difference of 0.080%), Indonesian (5.9%, a difference of 0.090%), West Indian (5.9%, a difference of 0.13%), German Russian (5.9%, a difference of 0.15%), and Immigrants from Germany (5.9%, a difference of 0.15%).
| Demographics | Rating | Rank | Disability Age 5 to 17 |
| Immigrants | Kenya | 3.4 /100 | #234 | Tragic 5.8% |
| Malaysians | 3.4 /100 | #235 | Tragic 5.8% |
| Immigrants | Brazil | 3.2 /100 | #236 | Tragic 5.8% |
| Sudanese | 2.9 /100 | #237 | Tragic 5.8% |
| Hungarians | 2.6 /100 | #238 | Tragic 5.8% |
| German Russians | 2.4 /100 | #239 | Tragic 5.9% |
| West Indians | 2.4 /100 | #240 | Tragic 5.9% |
| Immigrants | Caribbean | 2.1 /100 | #241 | Tragic 5.9% |
| Spaniards | 2.0 /100 | #242 | Tragic 5.9% |
| Indonesians | 2.0 /100 | #243 | Tragic 5.9% |
| Immigrants | Germany | 1.9 /100 | #244 | Tragic 5.9% |
| Immigrants | Micronesia | 1.9 /100 | #245 | Tragic 5.9% |
| Tlingit-Haida | 1.9 /100 | #246 | Tragic 5.9% |
| Immigrants | Honduras | 1.8 /100 | #247 | Tragic 5.9% |
| British | 1.7 /100 | #248 | Tragic 5.9% |