U.S. Virgin Islander vs Jordanian Male Poverty
COMPARE
U.S. Virgin Islander
Jordanian
Male Poverty
Male Poverty Comparison
U.S. Virgin Islanders
Jordanians
14.7%
MALE POVERTY
0.0/ 100
METRIC RATING
319th/ 347
METRIC RANK
10.4%
MALE POVERTY
94.4/ 100
METRIC RATING
92nd/ 347
METRIC RANK
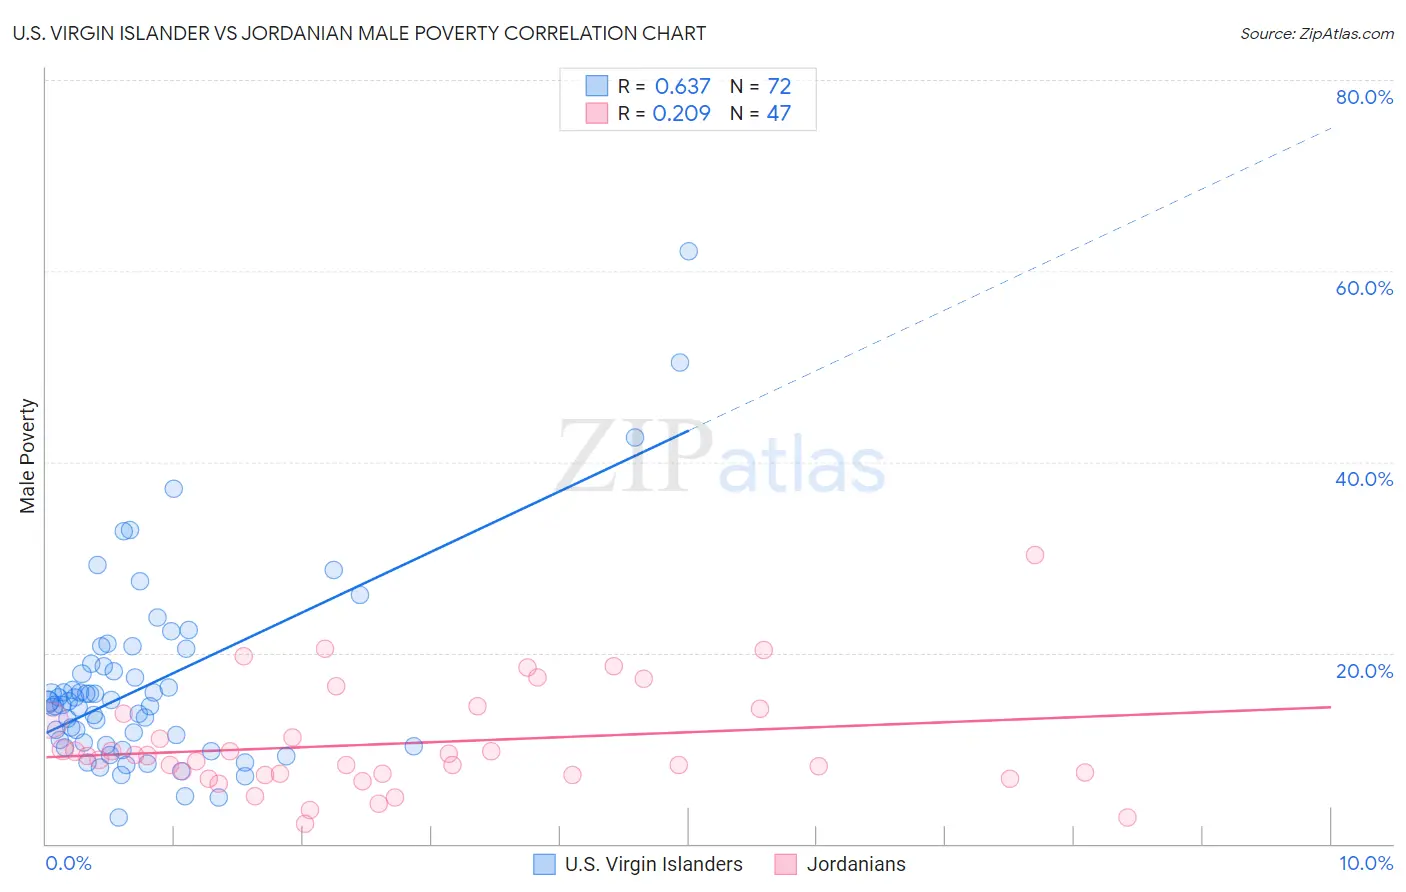
U.S. Virgin Islander vs Jordanian Male Poverty Correlation Chart
The statistical analysis conducted on geographies consisting of 87,513,000 people shows a significant positive correlation between the proportion of U.S. Virgin Islanders and poverty level among males in the United States with a correlation coefficient (R) of 0.637 and weighted average of 14.7%. Similarly, the statistical analysis conducted on geographies consisting of 166,386,715 people shows a weak positive correlation between the proportion of Jordanians and poverty level among males in the United States with a correlation coefficient (R) of 0.209 and weighted average of 10.4%, a difference of 41.3%.
Male Poverty Correlation Summary
| Measurement | U.S. Virgin Islander | Jordanian |
| Minimum | 2.7% | 2.1% |
| Maximum | 62.0% | 30.3% |
| Range | 59.3% | 28.2% |
| Mean | 16.8% | 10.5% |
| Median | 14.9% | 9.2% |
| Interquartile 25% (IQ1) | 10.4% | 7.3% |
| Interquartile 75% (IQ3) | 18.7% | 13.6% |
| Interquartile Range (IQR) | 8.3% | 6.4% |
| Standard Deviation (Sample) | 10.1% | 5.5% |
| Standard Deviation (Population) | 10.0% | 5.5% |
Similar Demographics by Male Poverty
Demographics Similar to U.S. Virgin Islanders by Male Poverty
In terms of male poverty, the demographic groups most similar to U.S. Virgin Islanders are Immigrants from Grenada (14.7%, a difference of 0.030%), Immigrants from Dominica (14.7%, a difference of 0.090%), Immigrants from Congo (14.7%, a difference of 0.090%), British West Indian (14.6%, a difference of 0.76%), and Chippewa (14.6%, a difference of 0.79%).
| Demographics | Rating | Rank | Male Poverty |
| Choctaw | 0.0 /100 | #312 | Tragic 14.4% |
| Immigrants | Somalia | 0.0 /100 | #313 | Tragic 14.6% |
| Immigrants | Honduras | 0.0 /100 | #314 | Tragic 14.6% |
| Chippewa | 0.0 /100 | #315 | Tragic 14.6% |
| British West Indians | 0.0 /100 | #316 | Tragic 14.6% |
| Immigrants | Dominica | 0.0 /100 | #317 | Tragic 14.7% |
| Immigrants | Grenada | 0.0 /100 | #318 | Tragic 14.7% |
| U.S. Virgin Islanders | 0.0 /100 | #319 | Tragic 14.7% |
| Immigrants | Congo | 0.0 /100 | #320 | Tragic 14.7% |
| Arapaho | 0.0 /100 | #321 | Tragic 15.1% |
| Kiowa | 0.0 /100 | #322 | Tragic 15.2% |
| Colville | 0.0 /100 | #323 | Tragic 15.2% |
| Menominee | 0.0 /100 | #324 | Tragic 15.3% |
| Yakama | 0.0 /100 | #325 | Tragic 15.3% |
| Central American Indians | 0.0 /100 | #326 | Tragic 15.3% |
Demographics Similar to Jordanians by Male Poverty
In terms of male poverty, the demographic groups most similar to Jordanians are Australian (10.4%, a difference of 0.0%), Immigrants from South Africa (10.4%, a difference of 0.17%), British (10.4%, a difference of 0.20%), Scottish (10.4%, a difference of 0.21%), and Indian (Asian) (10.4%, a difference of 0.27%).
| Demographics | Rating | Rank | Male Poverty |
| Immigrants | England | 95.5 /100 | #85 | Exceptional 10.4% |
| Immigrants | Eastern Asia | 95.3 /100 | #86 | Exceptional 10.4% |
| Northern Europeans | 95.2 /100 | #87 | Exceptional 10.4% |
| Cambodians | 95.0 /100 | #88 | Exceptional 10.4% |
| Immigrants | Denmark | 95.0 /100 | #89 | Exceptional 10.4% |
| Indians (Asian) | 94.9 /100 | #90 | Exceptional 10.4% |
| British | 94.8 /100 | #91 | Exceptional 10.4% |
| Jordanians | 94.4 /100 | #92 | Exceptional 10.4% |
| Australians | 94.4 /100 | #93 | Exceptional 10.4% |
| Immigrants | South Africa | 94.1 /100 | #94 | Exceptional 10.4% |
| Scottish | 94.0 /100 | #95 | Exceptional 10.4% |
| Immigrants | Egypt | 93.7 /100 | #96 | Exceptional 10.4% |
| Romanians | 93.6 /100 | #97 | Exceptional 10.5% |
| Finns | 93.4 /100 | #98 | Exceptional 10.5% |
| Immigrants | Indonesia | 93.3 /100 | #99 | Exceptional 10.5% |