U.S. Virgin Islander vs Jordanian Doctorate Degree
COMPARE
U.S. Virgin Islander
Jordanian
Doctorate Degree
Doctorate Degree Comparison
U.S. Virgin Islanders
Jordanians
1.5%
DOCTORATE DEGREE
0.5/ 100
METRIC RATING
268th/ 347
METRIC RANK
2.0%
DOCTORATE DEGREE
92.1/ 100
METRIC RATING
126th/ 347
METRIC RANK
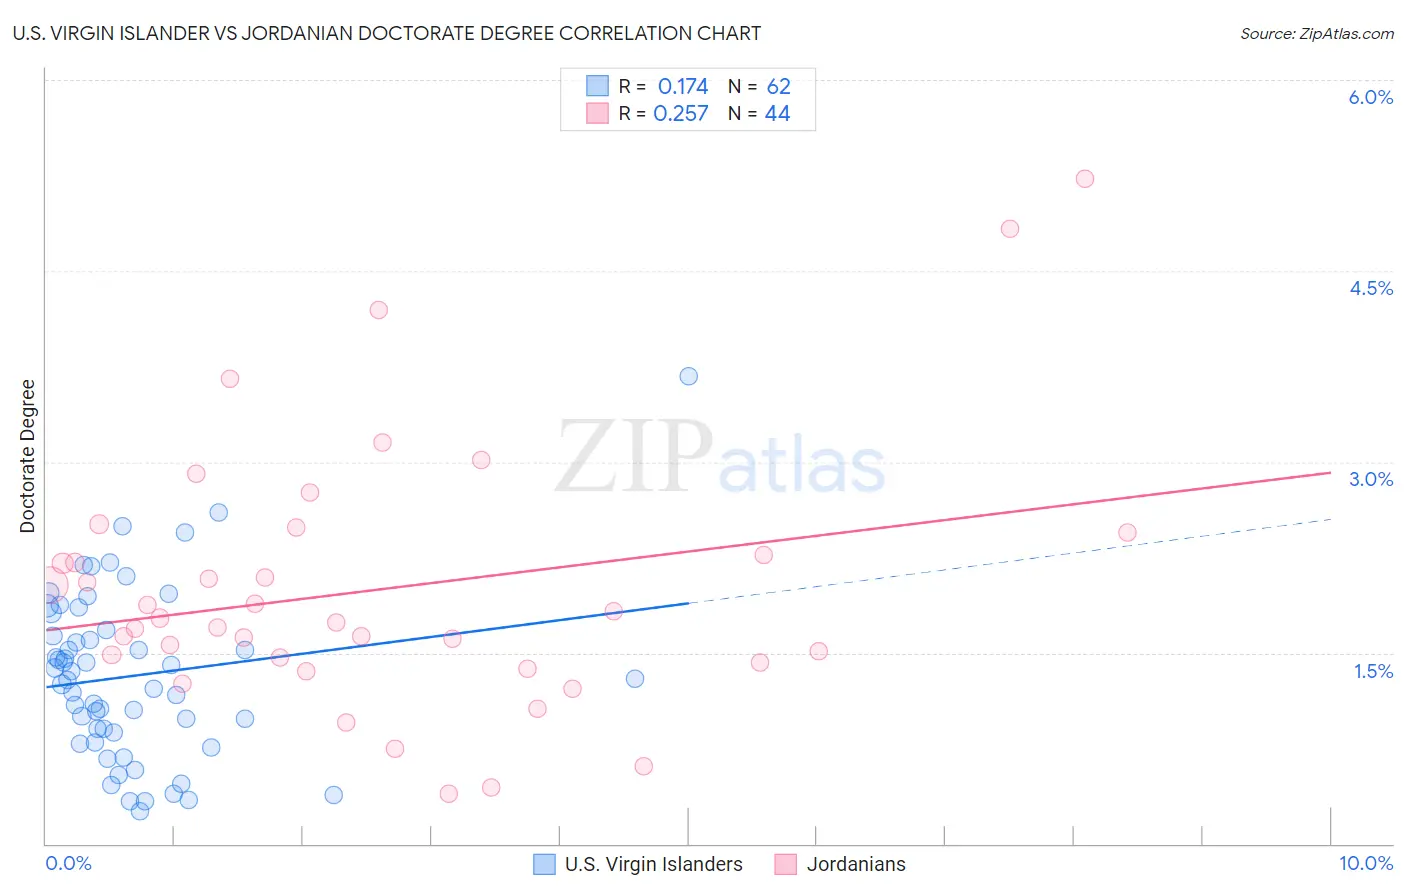
U.S. Virgin Islander vs Jordanian Doctorate Degree Correlation Chart
The statistical analysis conducted on geographies consisting of 87,354,838 people shows a poor positive correlation between the proportion of U.S. Virgin Islanders and percentage of population with at least doctorate degree education in the United States with a correlation coefficient (R) of 0.174 and weighted average of 1.5%. Similarly, the statistical analysis conducted on geographies consisting of 166,045,930 people shows a weak positive correlation between the proportion of Jordanians and percentage of population with at least doctorate degree education in the United States with a correlation coefficient (R) of 0.257 and weighted average of 2.0%, a difference of 35.6%.
Doctorate Degree Correlation Summary
| Measurement | U.S. Virgin Islander | Jordanian |
| Minimum | 0.26% | 0.39% |
| Maximum | 3.7% | 5.2% |
| Range | 3.4% | 4.8% |
| Mean | 1.3% | 2.0% |
| Median | 1.3% | 1.8% |
| Interquartile 25% (IQ1) | 0.87% | 1.4% |
| Interquartile 75% (IQ3) | 1.7% | 2.4% |
| Interquartile Range (IQR) | 0.80% | 0.91% |
| Standard Deviation (Sample) | 0.67% | 1.0% |
| Standard Deviation (Population) | 0.66% | 1.0% |
Similar Demographics by Doctorate Degree
Demographics Similar to U.S. Virgin Islanders by Doctorate Degree
In terms of doctorate degree, the demographic groups most similar to U.S. Virgin Islanders are Kiowa (1.5%, a difference of 0.0%), Crow (1.5%, a difference of 0.090%), Salvadoran (1.5%, a difference of 0.11%), Immigrants from Trinidad and Tobago (1.5%, a difference of 0.19%), and Immigrants from Barbados (1.5%, a difference of 0.27%).
| Demographics | Rating | Rank | Doctorate Degree |
| Immigrants | Portugal | 0.8 /100 | #261 | Tragic 1.5% |
| Chickasaw | 0.7 /100 | #262 | Tragic 1.5% |
| Immigrants | Bahamas | 0.7 /100 | #263 | Tragic 1.5% |
| Blackfeet | 0.7 /100 | #264 | Tragic 1.5% |
| Nicaraguans | 0.6 /100 | #265 | Tragic 1.5% |
| Immigrants | Liberia | 0.5 /100 | #266 | Tragic 1.5% |
| Kiowa | 0.5 /100 | #267 | Tragic 1.5% |
| U.S. Virgin Islanders | 0.5 /100 | #268 | Tragic 1.5% |
| Crow | 0.5 /100 | #269 | Tragic 1.5% |
| Salvadorans | 0.5 /100 | #270 | Tragic 1.5% |
| Immigrants | Trinidad and Tobago | 0.5 /100 | #271 | Tragic 1.5% |
| Immigrants | Barbados | 0.4 /100 | #272 | Tragic 1.5% |
| Sioux | 0.4 /100 | #273 | Tragic 1.5% |
| Yaqui | 0.4 /100 | #274 | Tragic 1.5% |
| Aleuts | 0.4 /100 | #275 | Tragic 1.5% |
Demographics Similar to Jordanians by Doctorate Degree
In terms of doctorate degree, the demographic groups most similar to Jordanians are Palestinian (2.0%, a difference of 0.040%), Moroccan (2.0%, a difference of 0.42%), Immigrants from Zaire (2.0%, a difference of 0.46%), Ute (2.0%, a difference of 0.52%), and Canadian (2.0%, a difference of 0.67%).
| Demographics | Rating | Rank | Doctorate Degree |
| Pakistanis | 95.8 /100 | #119 | Exceptional 2.0% |
| Immigrants | Morocco | 95.5 /100 | #120 | Exceptional 2.0% |
| Immigrants | Jordan | 94.8 /100 | #121 | Exceptional 2.0% |
| Immigrants | Southern Europe | 94.7 /100 | #122 | Exceptional 2.0% |
| Croatians | 94.0 /100 | #123 | Exceptional 2.0% |
| Ute | 93.2 /100 | #124 | Exceptional 2.0% |
| Moroccans | 93.0 /100 | #125 | Exceptional 2.0% |
| Jordanians | 92.1 /100 | #126 | Exceptional 2.0% |
| Palestinians | 92.0 /100 | #127 | Exceptional 2.0% |
| Immigrants | Zaire | 91.1 /100 | #128 | Exceptional 2.0% |
| Canadians | 90.6 /100 | #129 | Exceptional 2.0% |
| Immigrants | Ukraine | 90.5 /100 | #130 | Exceptional 2.0% |
| Immigrants | Sierra Leone | 90.2 /100 | #131 | Exceptional 2.0% |
| Scottish | 89.4 /100 | #132 | Excellent 2.0% |
| Immigrants | Uzbekistan | 89.3 /100 | #133 | Excellent 2.0% |