Sioux vs Ottawa Disability Age 5 to 17
COMPARE
Sioux
Ottawa
Disability Age 5 to 17
Disability Age 5 to 17 Comparison
Sioux
Ottawa
6.0%
DISABILITY AGE 5 TO 17
0.4/ 100
METRIC RATING
268th/ 347
METRIC RANK
6.8%
DISABILITY AGE 5 TO 17
0.0/ 100
METRIC RATING
335th/ 347
METRIC RANK
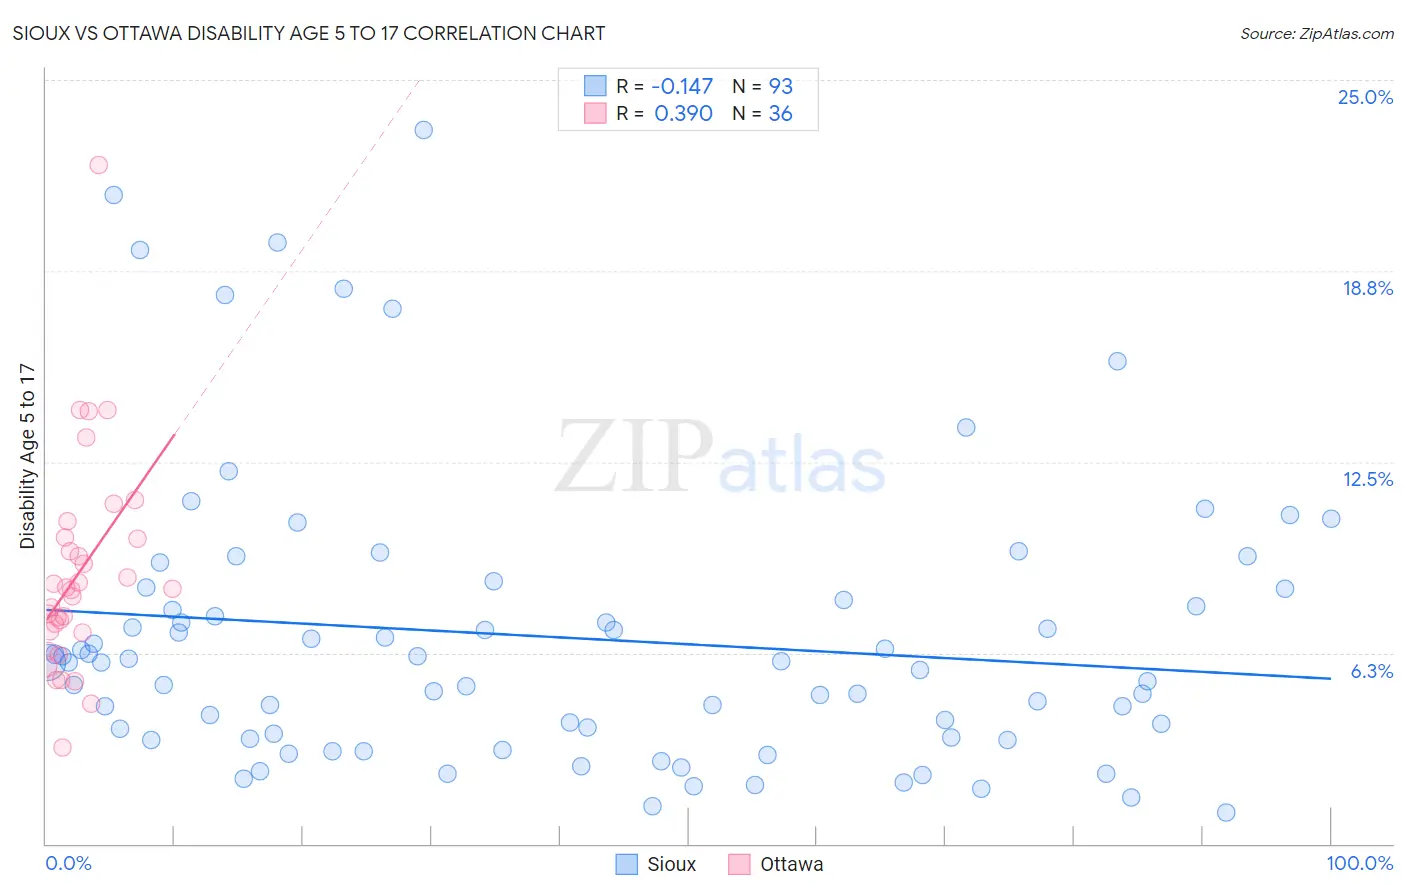
Sioux vs Ottawa Disability Age 5 to 17 Correlation Chart
The statistical analysis conducted on geographies consisting of 232,872,632 people shows a poor negative correlation between the proportion of Sioux and percentage of population with a disability between the ages 5 and 17 in the United States with a correlation coefficient (R) of -0.147 and weighted average of 6.0%. Similarly, the statistical analysis conducted on geographies consisting of 49,831,425 people shows a mild positive correlation between the proportion of Ottawa and percentage of population with a disability between the ages 5 and 17 in the United States with a correlation coefficient (R) of 0.390 and weighted average of 6.8%, a difference of 13.9%.
Disability Age 5 to 17 Correlation Summary
| Measurement | Sioux | Ottawa |
| Minimum | 1.0% | 3.1% |
| Maximum | 23.4% | 22.2% |
| Range | 22.4% | 19.1% |
| Mean | 6.8% | 8.8% |
| Median | 5.9% | 8.3% |
| Interquartile 25% (IQ1) | 3.5% | 6.9% |
| Interquartile 75% (IQ3) | 8.2% | 10.0% |
| Interquartile Range (IQR) | 4.7% | 3.1% |
| Standard Deviation (Sample) | 4.7% | 3.5% |
| Standard Deviation (Population) | 4.7% | 3.5% |
Similar Demographics by Disability Age 5 to 17
Demographics Similar to Sioux by Disability Age 5 to 17
In terms of disability age 5 to 17, the demographic groups most similar to Sioux are Liberian (6.0%, a difference of 0.030%), Spanish (6.0%, a difference of 0.19%), Immigrants from Somalia (6.0%, a difference of 0.22%), Slovene (6.0%, a difference of 0.30%), and Panamanian (6.0%, a difference of 0.33%).
| Demographics | Rating | Rank | Disability Age 5 to 17 |
| Immigrants | Middle Africa | 0.7 /100 | #261 | Tragic 5.9% |
| Immigrants | Western Africa | 0.7 /100 | #262 | Tragic 5.9% |
| Czechoslovakians | 0.7 /100 | #263 | Tragic 5.9% |
| Canadians | 0.6 /100 | #264 | Tragic 6.0% |
| Panamanians | 0.6 /100 | #265 | Tragic 6.0% |
| Slovenes | 0.6 /100 | #266 | Tragic 6.0% |
| Spanish | 0.5 /100 | #267 | Tragic 6.0% |
| Sioux | 0.4 /100 | #268 | Tragic 6.0% |
| Liberians | 0.4 /100 | #269 | Tragic 6.0% |
| Immigrants | Somalia | 0.4 /100 | #270 | Tragic 6.0% |
| Immigrants | Zaire | 0.2 /100 | #271 | Tragic 6.0% |
| Finns | 0.2 /100 | #272 | Tragic 6.0% |
| Alaska Natives | 0.2 /100 | #273 | Tragic 6.0% |
| Cheyenne | 0.2 /100 | #274 | Tragic 6.0% |
| Dutch | 0.2 /100 | #275 | Tragic 6.0% |
Demographics Similar to Ottawa by Disability Age 5 to 17
In terms of disability age 5 to 17, the demographic groups most similar to Ottawa are Chickasaw (6.8%, a difference of 0.50%), Seminole (6.8%, a difference of 0.70%), Black/African American (6.8%, a difference of 0.75%), Creek (6.9%, a difference of 0.93%), and Iroquois (6.9%, a difference of 1.2%).
| Demographics | Rating | Rank | Disability Age 5 to 17 |
| Pennsylvania Germans | 0.0 /100 | #328 | Tragic 6.6% |
| Blackfeet | 0.0 /100 | #329 | Tragic 6.6% |
| Dutch West Indians | 0.0 /100 | #330 | Tragic 6.7% |
| French Canadians | 0.0 /100 | #331 | Tragic 6.7% |
| Immigrants | Azores | 0.0 /100 | #332 | Tragic 6.7% |
| Blacks/African Americans | 0.0 /100 | #333 | Tragic 6.8% |
| Seminole | 0.0 /100 | #334 | Tragic 6.8% |
| Ottawa | 0.0 /100 | #335 | Tragic 6.8% |
| Chickasaw | 0.0 /100 | #336 | Tragic 6.8% |
| Creek | 0.0 /100 | #337 | Tragic 6.9% |
| Iroquois | 0.0 /100 | #338 | Tragic 6.9% |
| Choctaw | 0.0 /100 | #339 | Tragic 6.9% |
| Cherokee | 0.0 /100 | #340 | Tragic 6.9% |
| Cape Verdeans | 0.0 /100 | #341 | Tragic 7.0% |
| Chippewa | 0.0 /100 | #342 | Tragic 7.1% |