Turkish vs Ottawa Single Father Households
COMPARE
Turkish
Ottawa
Single Father Households
Single Father Households Comparison
Turks
Ottawa
2.0%
SINGLE FATHER HOUSEHOLDS
100.0/ 100
METRIC RATING
33rd/ 347
METRIC RANK
2.7%
SINGLE FATHER HOUSEHOLDS
0.1/ 100
METRIC RATING
285th/ 347
METRIC RANK
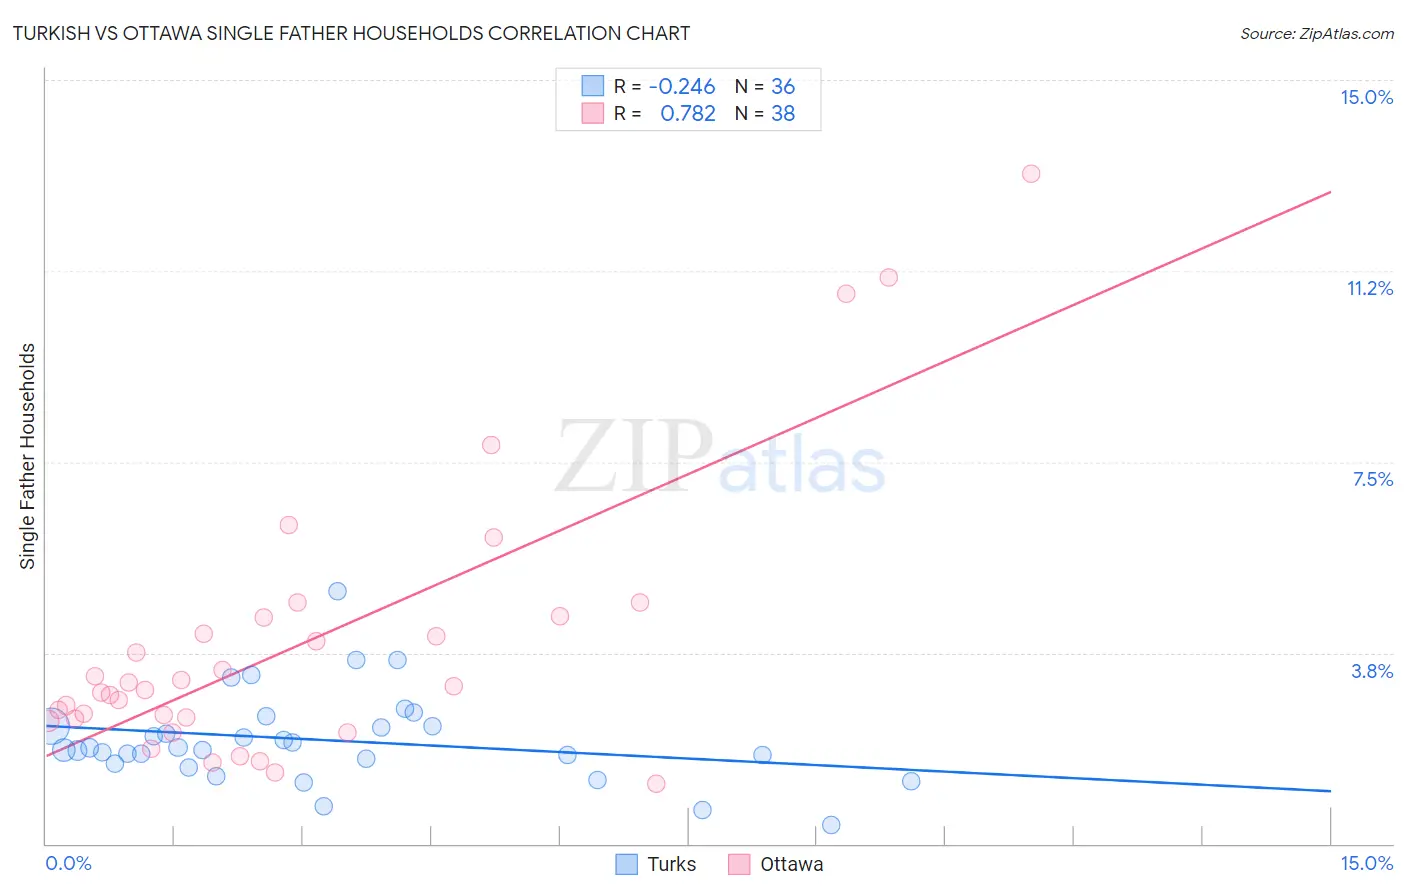
Turkish vs Ottawa Single Father Households Correlation Chart
The statistical analysis conducted on geographies consisting of 270,298,276 people shows a weak negative correlation between the proportion of Turks and percentage of single father households in the United States with a correlation coefficient (R) of -0.246 and weighted average of 2.0%. Similarly, the statistical analysis conducted on geographies consisting of 49,872,808 people shows a strong positive correlation between the proportion of Ottawa and percentage of single father households in the United States with a correlation coefficient (R) of 0.782 and weighted average of 2.7%, a difference of 34.7%.
Single Father Households Correlation Summary
| Measurement | Turkish | Ottawa |
| Minimum | 0.37% | 1.2% |
| Maximum | 5.0% | 13.2% |
| Range | 4.6% | 12.0% |
| Mean | 2.0% | 3.9% |
| Median | 1.9% | 3.1% |
| Interquartile 25% (IQ1) | 1.6% | 2.4% |
| Interquartile 75% (IQ3) | 2.3% | 4.4% |
| Interquartile Range (IQR) | 0.70% | 2.0% |
| Standard Deviation (Sample) | 0.89% | 2.7% |
| Standard Deviation (Population) | 0.88% | 2.7% |
Similar Demographics by Single Father Households
Demographics Similar to Turks by Single Father Households
In terms of single father households, the demographic groups most similar to Turks are Immigrants from Australia (2.0%, a difference of 0.020%), Chinese (2.0%, a difference of 0.21%), Israeli (2.0%, a difference of 0.25%), Cambodian (2.0%, a difference of 0.28%), and Bulgarian (2.0%, a difference of 0.31%).
| Demographics | Rating | Rank | Single Father Households |
| Assyrians/Chaldeans/Syriacs | 100.0 /100 | #26 | Exceptional 2.0% |
| Immigrants | South Central Asia | 100.0 /100 | #27 | Exceptional 2.0% |
| Immigrants | Japan | 100.0 /100 | #28 | Exceptional 2.0% |
| Bulgarians | 100.0 /100 | #29 | Exceptional 2.0% |
| Cambodians | 100.0 /100 | #30 | Exceptional 2.0% |
| Israelis | 100.0 /100 | #31 | Exceptional 2.0% |
| Chinese | 100.0 /100 | #32 | Exceptional 2.0% |
| Turks | 100.0 /100 | #33 | Exceptional 2.0% |
| Immigrants | Australia | 100.0 /100 | #34 | Exceptional 2.0% |
| Albanians | 100.0 /100 | #35 | Exceptional 2.0% |
| Immigrants | Belgium | 100.0 /100 | #36 | Exceptional 2.0% |
| Immigrants | St. Vincent and the Grenadines | 100.0 /100 | #37 | Exceptional 2.0% |
| Immigrants | Eastern Europe | 100.0 /100 | #38 | Exceptional 2.0% |
| Immigrants | Sri Lanka | 100.0 /100 | #39 | Exceptional 2.0% |
| Immigrants | Bulgaria | 100.0 /100 | #40 | Exceptional 2.0% |
Demographics Similar to Ottawa by Single Father Households
In terms of single father households, the demographic groups most similar to Ottawa are Immigrants from Cuba (2.7%, a difference of 0.010%), Hawaiian (2.7%, a difference of 0.090%), Immigrants from Nicaragua (2.7%, a difference of 0.14%), Central American Indian (2.7%, a difference of 0.16%), and Immigrants from Cambodia (2.7%, a difference of 0.41%).
| Demographics | Rating | Rank | Single Father Households |
| Cherokee | 0.1 /100 | #278 | Tragic 2.6% |
| Samoans | 0.1 /100 | #279 | Tragic 2.6% |
| Immigrants | Portugal | 0.1 /100 | #280 | Tragic 2.6% |
| Nicaraguans | 0.1 /100 | #281 | Tragic 2.6% |
| Dutch West Indians | 0.1 /100 | #282 | Tragic 2.6% |
| Immigrants | Nicaragua | 0.1 /100 | #283 | Tragic 2.7% |
| Hawaiians | 0.1 /100 | #284 | Tragic 2.7% |
| Ottawa | 0.1 /100 | #285 | Tragic 2.7% |
| Immigrants | Cuba | 0.1 /100 | #286 | Tragic 2.7% |
| Central American Indians | 0.0 /100 | #287 | Tragic 2.7% |
| Immigrants | Cambodia | 0.0 /100 | #288 | Tragic 2.7% |
| Tlingit-Haida | 0.0 /100 | #289 | Tragic 2.7% |
| Puget Sound Salish | 0.0 /100 | #290 | Tragic 2.7% |
| Blackfeet | 0.0 /100 | #291 | Tragic 2.7% |
| Choctaw | 0.0 /100 | #292 | Tragic 2.7% |