Immigrants from Germany vs Ottawa Disability Age 5 to 17
COMPARE
Immigrants from Germany
Ottawa
Disability Age 5 to 17
Disability Age 5 to 17 Comparison
Immigrants from Germany
Ottawa
5.9%
DISABILITY AGE 5 TO 17
1.9/ 100
METRIC RATING
244th/ 347
METRIC RANK
6.8%
DISABILITY AGE 5 TO 17
0.0/ 100
METRIC RATING
335th/ 347
METRIC RANK
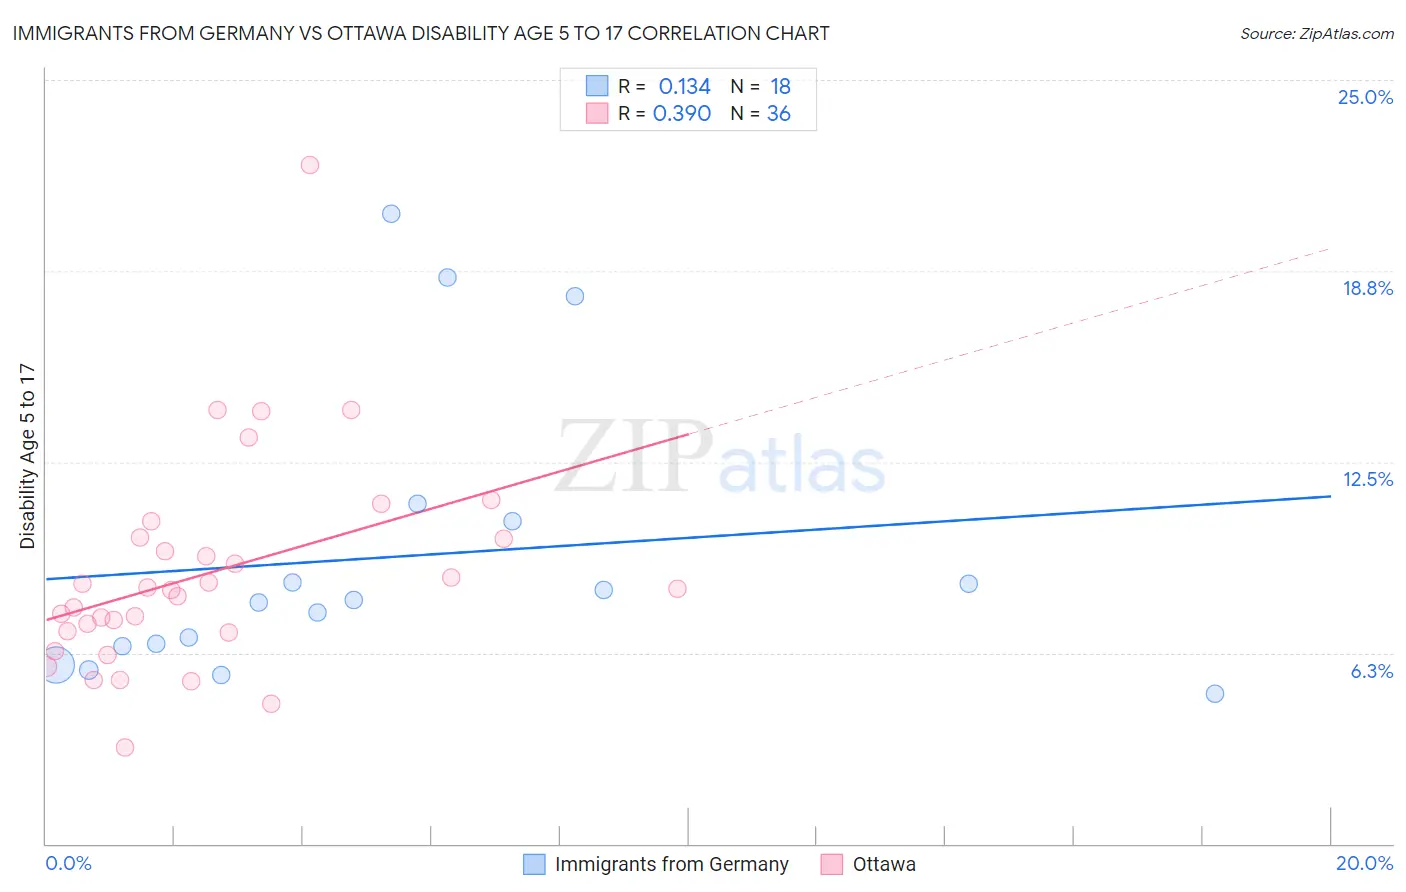
Immigrants from Germany vs Ottawa Disability Age 5 to 17 Correlation Chart
The statistical analysis conducted on geographies consisting of 458,518,539 people shows a poor positive correlation between the proportion of Immigrants from Germany and percentage of population with a disability between the ages 5 and 17 in the United States with a correlation coefficient (R) of 0.134 and weighted average of 5.9%. Similarly, the statistical analysis conducted on geographies consisting of 49,831,425 people shows a mild positive correlation between the proportion of Ottawa and percentage of population with a disability between the ages 5 and 17 in the United States with a correlation coefficient (R) of 0.390 and weighted average of 6.8%, a difference of 15.9%.
Disability Age 5 to 17 Correlation Summary
| Measurement | Immigrants from Germany | Ottawa |
| Minimum | 4.9% | 3.1% |
| Maximum | 20.6% | 22.2% |
| Range | 15.7% | 19.1% |
| Mean | 9.4% | 8.8% |
| Median | 7.9% | 8.3% |
| Interquartile 25% (IQ1) | 6.5% | 6.9% |
| Interquartile 75% (IQ3) | 10.5% | 10.0% |
| Interquartile Range (IQR) | 4.1% | 3.1% |
| Standard Deviation (Sample) | 4.7% | 3.5% |
| Standard Deviation (Population) | 4.6% | 3.5% |
Similar Demographics by Disability Age 5 to 17
Demographics Similar to Immigrants from Germany by Disability Age 5 to 17
In terms of disability age 5 to 17, the demographic groups most similar to Immigrants from Germany are Immigrants from Micronesia (5.9%, a difference of 0.0%), Tlingit-Haida (5.9%, a difference of 0.0%), Immigrants from Honduras (5.9%, a difference of 0.030%), Indonesian (5.9%, a difference of 0.060%), and Spaniard (5.9%, a difference of 0.070%).
| Demographics | Rating | Rank | Disability Age 5 to 17 |
| Sudanese | 2.9 /100 | #237 | Tragic 5.8% |
| Hungarians | 2.6 /100 | #238 | Tragic 5.8% |
| German Russians | 2.4 /100 | #239 | Tragic 5.9% |
| West Indians | 2.4 /100 | #240 | Tragic 5.9% |
| Immigrants | Caribbean | 2.1 /100 | #241 | Tragic 5.9% |
| Spaniards | 2.0 /100 | #242 | Tragic 5.9% |
| Indonesians | 2.0 /100 | #243 | Tragic 5.9% |
| Immigrants | Germany | 1.9 /100 | #244 | Tragic 5.9% |
| Immigrants | Micronesia | 1.9 /100 | #245 | Tragic 5.9% |
| Tlingit-Haida | 1.9 /100 | #246 | Tragic 5.9% |
| Immigrants | Honduras | 1.8 /100 | #247 | Tragic 5.9% |
| British | 1.7 /100 | #248 | Tragic 5.9% |
| Immigrants | Ghana | 1.7 /100 | #249 | Tragic 5.9% |
| Poles | 1.5 /100 | #250 | Tragic 5.9% |
| Immigrants | Cambodia | 1.5 /100 | #251 | Tragic 5.9% |
Demographics Similar to Ottawa by Disability Age 5 to 17
In terms of disability age 5 to 17, the demographic groups most similar to Ottawa are Chickasaw (6.8%, a difference of 0.50%), Seminole (6.8%, a difference of 0.70%), Black/African American (6.8%, a difference of 0.75%), Creek (6.9%, a difference of 0.93%), and Iroquois (6.9%, a difference of 1.2%).
| Demographics | Rating | Rank | Disability Age 5 to 17 |
| Pennsylvania Germans | 0.0 /100 | #328 | Tragic 6.6% |
| Blackfeet | 0.0 /100 | #329 | Tragic 6.6% |
| Dutch West Indians | 0.0 /100 | #330 | Tragic 6.7% |
| French Canadians | 0.0 /100 | #331 | Tragic 6.7% |
| Immigrants | Azores | 0.0 /100 | #332 | Tragic 6.7% |
| Blacks/African Americans | 0.0 /100 | #333 | Tragic 6.8% |
| Seminole | 0.0 /100 | #334 | Tragic 6.8% |
| Ottawa | 0.0 /100 | #335 | Tragic 6.8% |
| Chickasaw | 0.0 /100 | #336 | Tragic 6.8% |
| Creek | 0.0 /100 | #337 | Tragic 6.9% |
| Iroquois | 0.0 /100 | #338 | Tragic 6.9% |
| Choctaw | 0.0 /100 | #339 | Tragic 6.9% |
| Cherokee | 0.0 /100 | #340 | Tragic 6.9% |
| Cape Verdeans | 0.0 /100 | #341 | Tragic 7.0% |
| Chippewa | 0.0 /100 | #342 | Tragic 7.1% |