Tsimshian vs Australian Self-Care Disability
COMPARE
Tsimshian
Australian
Self-Care Disability
Self-Care Disability Comparison
Tsimshian
Australians
2.6%
SELF-CARE DISABILITY
0.3/ 100
METRIC RATING
255th/ 347
METRIC RANK
2.3%
SELF-CARE DISABILITY
99.6/ 100
METRIC RATING
53rd/ 347
METRIC RANK
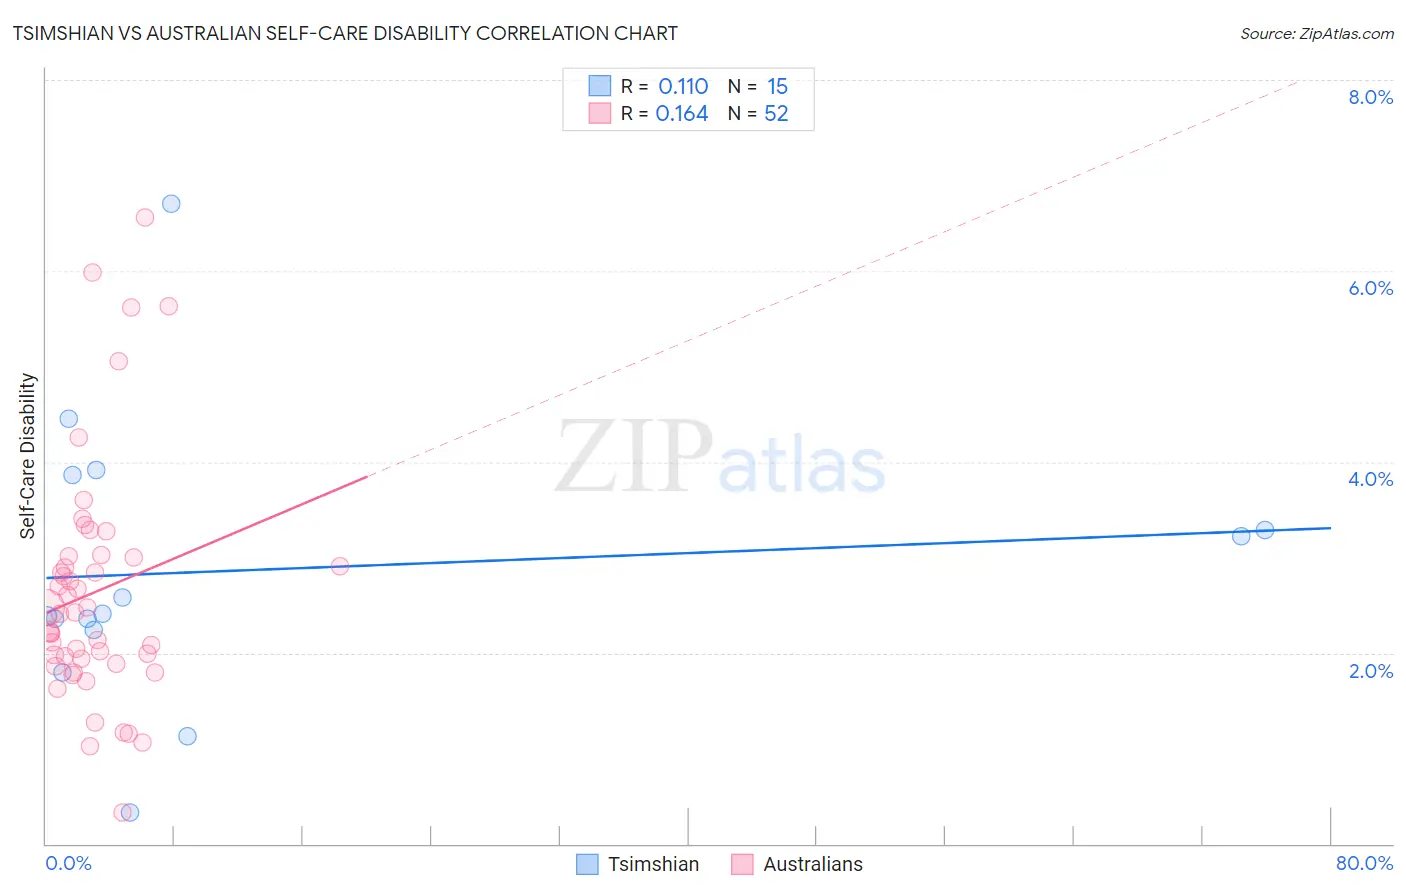
Tsimshian vs Australian Self-Care Disability Correlation Chart
The statistical analysis conducted on geographies consisting of 15,618,387 people shows a poor positive correlation between the proportion of Tsimshian and percentage of population with self-care disability in the United States with a correlation coefficient (R) of 0.110 and weighted average of 2.6%. Similarly, the statistical analysis conducted on geographies consisting of 223,956,744 people shows a poor positive correlation between the proportion of Australians and percentage of population with self-care disability in the United States with a correlation coefficient (R) of 0.164 and weighted average of 2.3%, a difference of 14.4%.
Self-Care Disability Correlation Summary
| Measurement | Tsimshian | Australian |
| Minimum | 0.32% | 0.32% |
| Maximum | 6.7% | 6.6% |
| Range | 6.4% | 6.2% |
| Mean | 2.9% | 2.6% |
| Median | 2.4% | 2.4% |
| Interquartile 25% (IQ1) | 2.2% | 1.9% |
| Interquartile 75% (IQ3) | 3.9% | 3.0% |
| Interquartile Range (IQR) | 1.6% | 1.1% |
| Standard Deviation (Sample) | 1.5% | 1.3% |
| Standard Deviation (Population) | 1.5% | 1.3% |
Similar Demographics by Self-Care Disability
Demographics Similar to Tsimshian by Self-Care Disability
In terms of self-care disability, the demographic groups most similar to Tsimshian are Immigrants from Central America (2.6%, a difference of 0.020%), Haitian (2.6%, a difference of 0.040%), Immigrants from Haiti (2.6%, a difference of 0.060%), Immigrants from Bangladesh (2.6%, a difference of 0.14%), and Immigrants from Liberia (2.6%, a difference of 0.21%).
| Demographics | Rating | Rank | Self-Care Disability |
| Nicaraguans | 0.6 /100 | #248 | Tragic 2.6% |
| Mexican American Indians | 0.5 /100 | #249 | Tragic 2.6% |
| Portuguese | 0.4 /100 | #250 | Tragic 2.6% |
| Immigrants | Liberia | 0.4 /100 | #251 | Tragic 2.6% |
| Immigrants | Bangladesh | 0.4 /100 | #252 | Tragic 2.6% |
| Immigrants | Haiti | 0.3 /100 | #253 | Tragic 2.6% |
| Haitians | 0.3 /100 | #254 | Tragic 2.6% |
| Tsimshian | 0.3 /100 | #255 | Tragic 2.6% |
| Immigrants | Central America | 0.3 /100 | #256 | Tragic 2.6% |
| Potawatomi | 0.3 /100 | #257 | Tragic 2.6% |
| Immigrants | Nonimmigrants | 0.3 /100 | #258 | Tragic 2.6% |
| Immigrants | Belarus | 0.2 /100 | #259 | Tragic 2.6% |
| Chippewa | 0.2 /100 | #260 | Tragic 2.6% |
| Arapaho | 0.2 /100 | #261 | Tragic 2.6% |
| Shoshone | 0.2 /100 | #262 | Tragic 2.7% |
Demographics Similar to Australians by Self-Care Disability
In terms of self-care disability, the demographic groups most similar to Australians are Immigrants from Serbia (2.3%, a difference of 0.030%), Argentinean (2.3%, a difference of 0.050%), Kenyan (2.3%, a difference of 0.060%), Immigrants from France (2.3%, a difference of 0.11%), and Immigrants from Eastern Asia (2.3%, a difference of 0.15%).
| Demographics | Rating | Rank | Self-Care Disability |
| Czechs | 99.8 /100 | #46 | Exceptional 2.3% |
| Jordanians | 99.7 /100 | #47 | Exceptional 2.3% |
| Immigrants | Malaysia | 99.7 /100 | #48 | Exceptional 2.3% |
| Latvians | 99.7 /100 | #49 | Exceptional 2.3% |
| Immigrants | Brazil | 99.7 /100 | #50 | Exceptional 2.3% |
| Kenyans | 99.7 /100 | #51 | Exceptional 2.3% |
| Immigrants | Serbia | 99.6 /100 | #52 | Exceptional 2.3% |
| Australians | 99.6 /100 | #53 | Exceptional 2.3% |
| Argentineans | 99.6 /100 | #54 | Exceptional 2.3% |
| Immigrants | France | 99.6 /100 | #55 | Exceptional 2.3% |
| Immigrants | Eastern Asia | 99.6 /100 | #56 | Exceptional 2.3% |
| Immigrants | Belgium | 99.6 /100 | #57 | Exceptional 2.3% |
| Immigrants | Cameroon | 99.6 /100 | #58 | Exceptional 2.3% |
| New Zealanders | 99.5 /100 | #59 | Exceptional 2.3% |
| Immigrants | Japan | 99.5 /100 | #60 | Exceptional 2.3% |