Czechoslovakian vs Australian Self-Care Disability
COMPARE
Czechoslovakian
Australian
Self-Care Disability
Self-Care Disability Comparison
Czechoslovakians
Australians
2.5%
SELF-CARE DISABILITY
53.5/ 100
METRIC RATING
172nd/ 347
METRIC RANK
2.3%
SELF-CARE DISABILITY
99.6/ 100
METRIC RATING
53rd/ 347
METRIC RANK
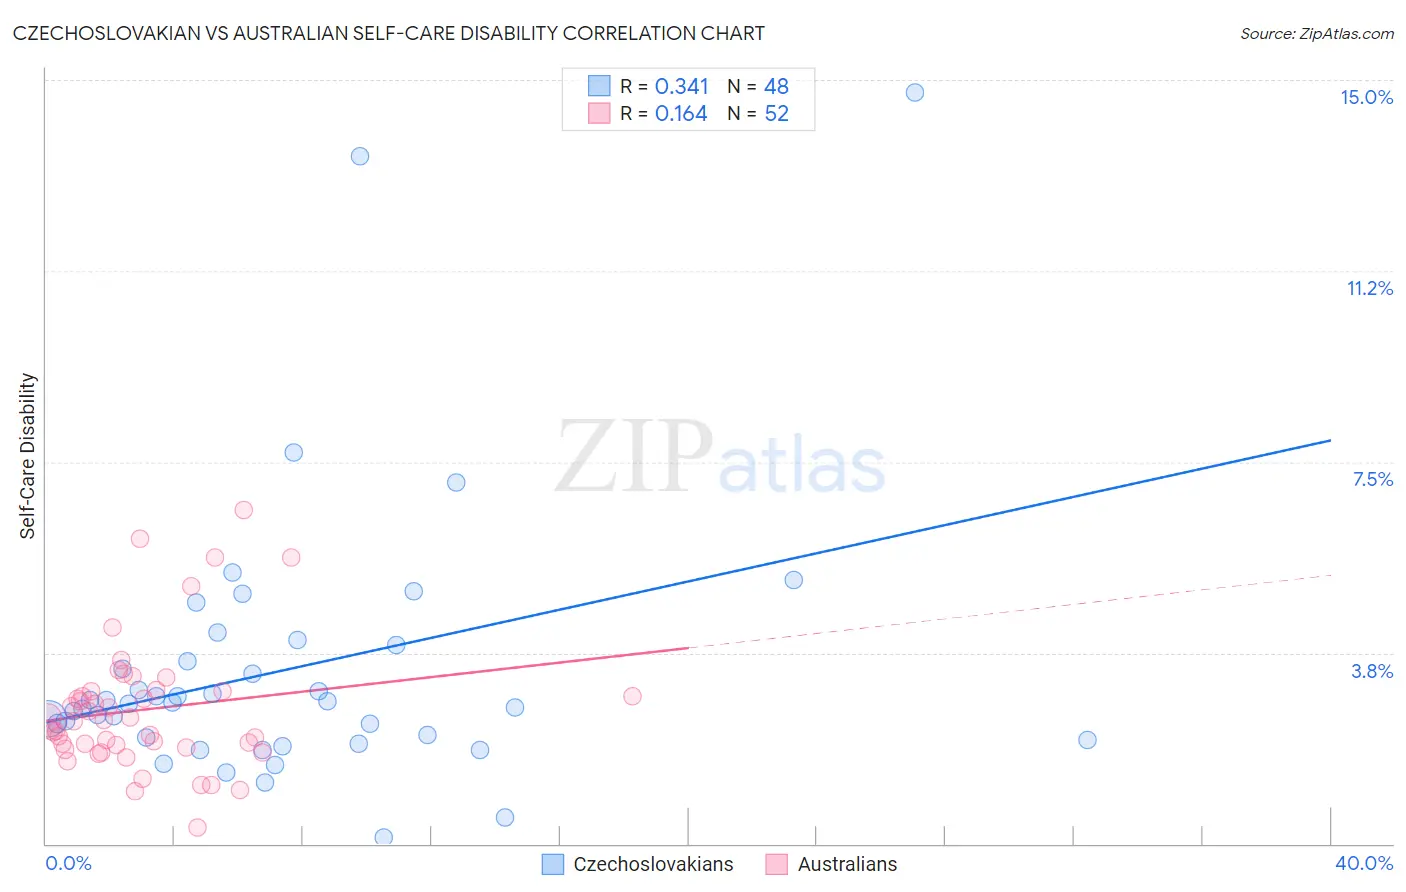
Czechoslovakian vs Australian Self-Care Disability Correlation Chart
The statistical analysis conducted on geographies consisting of 368,314,716 people shows a mild positive correlation between the proportion of Czechoslovakians and percentage of population with self-care disability in the United States with a correlation coefficient (R) of 0.341 and weighted average of 2.5%. Similarly, the statistical analysis conducted on geographies consisting of 223,956,744 people shows a poor positive correlation between the proportion of Australians and percentage of population with self-care disability in the United States with a correlation coefficient (R) of 0.164 and weighted average of 2.3%, a difference of 7.0%.
Self-Care Disability Correlation Summary
| Measurement | Czechoslovakian | Australian |
| Minimum | 0.12% | 0.32% |
| Maximum | 14.8% | 6.6% |
| Range | 14.6% | 6.2% |
| Mean | 3.4% | 2.6% |
| Median | 2.8% | 2.4% |
| Interquartile 25% (IQ1) | 2.1% | 1.9% |
| Interquartile 75% (IQ3) | 3.7% | 3.0% |
| Interquartile Range (IQR) | 1.7% | 1.1% |
| Standard Deviation (Sample) | 2.7% | 1.3% |
| Standard Deviation (Population) | 2.7% | 1.3% |
Similar Demographics by Self-Care Disability
Demographics Similar to Czechoslovakians by Self-Care Disability
In terms of self-care disability, the demographic groups most similar to Czechoslovakians are Pennsylvania German (2.5%, a difference of 0.0%), Immigrants from Burma/Myanmar (2.5%, a difference of 0.030%), Scottish (2.5%, a difference of 0.040%), Immigrants from Somalia (2.5%, a difference of 0.12%), and Welsh (2.5%, a difference of 0.17%).
| Demographics | Rating | Rank | Self-Care Disability |
| Syrians | 59.0 /100 | #165 | Average 2.5% |
| Canadians | 58.8 /100 | #166 | Average 2.5% |
| Immigrants | Greece | 57.3 /100 | #167 | Average 2.5% |
| Ute | 57.1 /100 | #168 | Average 2.5% |
| Immigrants | Somalia | 55.9 /100 | #169 | Average 2.5% |
| Scottish | 54.3 /100 | #170 | Average 2.5% |
| Pennsylvania Germans | 53.5 /100 | #171 | Average 2.5% |
| Czechoslovakians | 53.5 /100 | #172 | Average 2.5% |
| Immigrants | Burma/Myanmar | 52.8 /100 | #173 | Average 2.5% |
| Welsh | 50.0 /100 | #174 | Average 2.5% |
| Immigrants | Bosnia and Herzegovina | 49.6 /100 | #175 | Average 2.5% |
| Immigrants | Afghanistan | 47.6 /100 | #176 | Average 2.5% |
| Immigrants | Kazakhstan | 46.7 /100 | #177 | Average 2.5% |
| English | 46.2 /100 | #178 | Average 2.5% |
| Hungarians | 45.5 /100 | #179 | Average 2.5% |
Demographics Similar to Australians by Self-Care Disability
In terms of self-care disability, the demographic groups most similar to Australians are Immigrants from Serbia (2.3%, a difference of 0.030%), Argentinean (2.3%, a difference of 0.050%), Kenyan (2.3%, a difference of 0.060%), Immigrants from France (2.3%, a difference of 0.11%), and Immigrants from Eastern Asia (2.3%, a difference of 0.15%).
| Demographics | Rating | Rank | Self-Care Disability |
| Czechs | 99.8 /100 | #46 | Exceptional 2.3% |
| Jordanians | 99.7 /100 | #47 | Exceptional 2.3% |
| Immigrants | Malaysia | 99.7 /100 | #48 | Exceptional 2.3% |
| Latvians | 99.7 /100 | #49 | Exceptional 2.3% |
| Immigrants | Brazil | 99.7 /100 | #50 | Exceptional 2.3% |
| Kenyans | 99.7 /100 | #51 | Exceptional 2.3% |
| Immigrants | Serbia | 99.6 /100 | #52 | Exceptional 2.3% |
| Australians | 99.6 /100 | #53 | Exceptional 2.3% |
| Argentineans | 99.6 /100 | #54 | Exceptional 2.3% |
| Immigrants | France | 99.6 /100 | #55 | Exceptional 2.3% |
| Immigrants | Eastern Asia | 99.6 /100 | #56 | Exceptional 2.3% |
| Immigrants | Belgium | 99.6 /100 | #57 | Exceptional 2.3% |
| Immigrants | Cameroon | 99.6 /100 | #58 | Exceptional 2.3% |
| New Zealanders | 99.5 /100 | #59 | Exceptional 2.3% |
| Immigrants | Japan | 99.5 /100 | #60 | Exceptional 2.3% |