Cuban vs Australian Self-Care Disability
COMPARE
Cuban
Australian
Self-Care Disability
Self-Care Disability Comparison
Cubans
Australians
2.7%
SELF-CARE DISABILITY
0.0/ 100
METRIC RATING
290th/ 347
METRIC RANK
2.3%
SELF-CARE DISABILITY
99.6/ 100
METRIC RATING
53rd/ 347
METRIC RANK
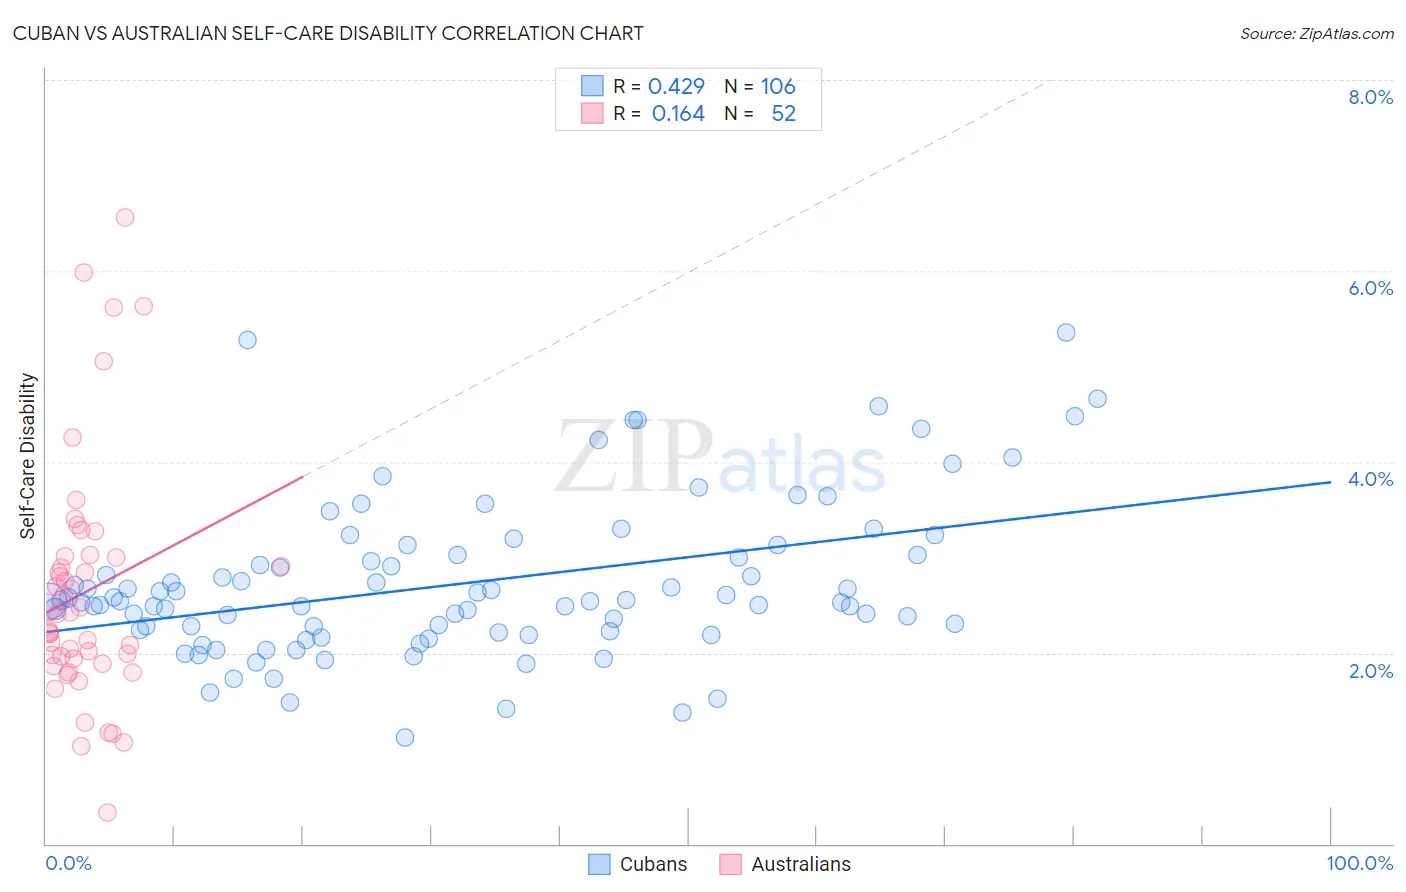
Cuban vs Australian Self-Care Disability Correlation Chart
The statistical analysis conducted on geographies consisting of 448,682,941 people shows a moderate positive correlation between the proportion of Cubans and percentage of population with self-care disability in the United States with a correlation coefficient (R) of 0.429 and weighted average of 2.7%. Similarly, the statistical analysis conducted on geographies consisting of 223,956,744 people shows a poor positive correlation between the proportion of Australians and percentage of population with self-care disability in the United States with a correlation coefficient (R) of 0.164 and weighted average of 2.3%, a difference of 18.6%.
Self-Care Disability Correlation Summary
| Measurement | Cuban | Australian |
| Minimum | 1.1% | 0.32% |
| Maximum | 5.4% | 6.6% |
| Range | 4.3% | 6.2% |
| Mean | 2.7% | 2.6% |
| Median | 2.5% | 2.4% |
| Interquartile 25% (IQ1) | 2.2% | 1.9% |
| Interquartile 75% (IQ3) | 3.0% | 3.0% |
| Interquartile Range (IQR) | 0.80% | 1.1% |
| Standard Deviation (Sample) | 0.82% | 1.3% |
| Standard Deviation (Population) | 0.81% | 1.3% |
Similar Demographics by Self-Care Disability
Demographics Similar to Cubans by Self-Care Disability
In terms of self-care disability, the demographic groups most similar to Cubans are African (2.7%, a difference of 0.15%), Immigrants from Barbados (2.7%, a difference of 0.25%), Guyanese (2.7%, a difference of 0.26%), Immigrants from Jamaica (2.7%, a difference of 0.29%), and Central American Indian (2.7%, a difference of 0.42%).
| Demographics | Rating | Rank | Self-Care Disability |
| Delaware | 0.0 /100 | #283 | Tragic 2.7% |
| Fijians | 0.0 /100 | #284 | Tragic 2.7% |
| Jamaicans | 0.0 /100 | #285 | Tragic 2.7% |
| French American Indians | 0.0 /100 | #286 | Tragic 2.7% |
| Immigrants | Jamaica | 0.0 /100 | #287 | Tragic 2.7% |
| Immigrants | Barbados | 0.0 /100 | #288 | Tragic 2.7% |
| Africans | 0.0 /100 | #289 | Tragic 2.7% |
| Cubans | 0.0 /100 | #290 | Tragic 2.7% |
| Guyanese | 0.0 /100 | #291 | Tragic 2.7% |
| Central American Indians | 0.0 /100 | #292 | Tragic 2.7% |
| Belizeans | 0.0 /100 | #293 | Tragic 2.7% |
| Blackfeet | 0.0 /100 | #294 | Tragic 2.7% |
| Barbadians | 0.0 /100 | #295 | Tragic 2.7% |
| Immigrants | Portugal | 0.0 /100 | #296 | Tragic 2.8% |
| West Indians | 0.0 /100 | #297 | Tragic 2.8% |
Demographics Similar to Australians by Self-Care Disability
In terms of self-care disability, the demographic groups most similar to Australians are Immigrants from Serbia (2.3%, a difference of 0.030%), Argentinean (2.3%, a difference of 0.050%), Kenyan (2.3%, a difference of 0.060%), Immigrants from France (2.3%, a difference of 0.11%), and Immigrants from Eastern Asia (2.3%, a difference of 0.15%).
| Demographics | Rating | Rank | Self-Care Disability |
| Czechs | 99.8 /100 | #46 | Exceptional 2.3% |
| Jordanians | 99.7 /100 | #47 | Exceptional 2.3% |
| Immigrants | Malaysia | 99.7 /100 | #48 | Exceptional 2.3% |
| Latvians | 99.7 /100 | #49 | Exceptional 2.3% |
| Immigrants | Brazil | 99.7 /100 | #50 | Exceptional 2.3% |
| Kenyans | 99.7 /100 | #51 | Exceptional 2.3% |
| Immigrants | Serbia | 99.6 /100 | #52 | Exceptional 2.3% |
| Australians | 99.6 /100 | #53 | Exceptional 2.3% |
| Argentineans | 99.6 /100 | #54 | Exceptional 2.3% |
| Immigrants | France | 99.6 /100 | #55 | Exceptional 2.3% |
| Immigrants | Eastern Asia | 99.6 /100 | #56 | Exceptional 2.3% |
| Immigrants | Belgium | 99.6 /100 | #57 | Exceptional 2.3% |
| Immigrants | Cameroon | 99.6 /100 | #58 | Exceptional 2.3% |
| New Zealanders | 99.5 /100 | #59 | Exceptional 2.3% |
| Immigrants | Japan | 99.5 /100 | #60 | Exceptional 2.3% |