Peruvian vs Australian Self-Care Disability
COMPARE
Peruvian
Australian
Self-Care Disability
Self-Care Disability Comparison
Peruvians
Australians
2.4%
SELF-CARE DISABILITY
91.3/ 100
METRIC RATING
121st/ 347
METRIC RANK
2.3%
SELF-CARE DISABILITY
99.6/ 100
METRIC RATING
53rd/ 347
METRIC RANK
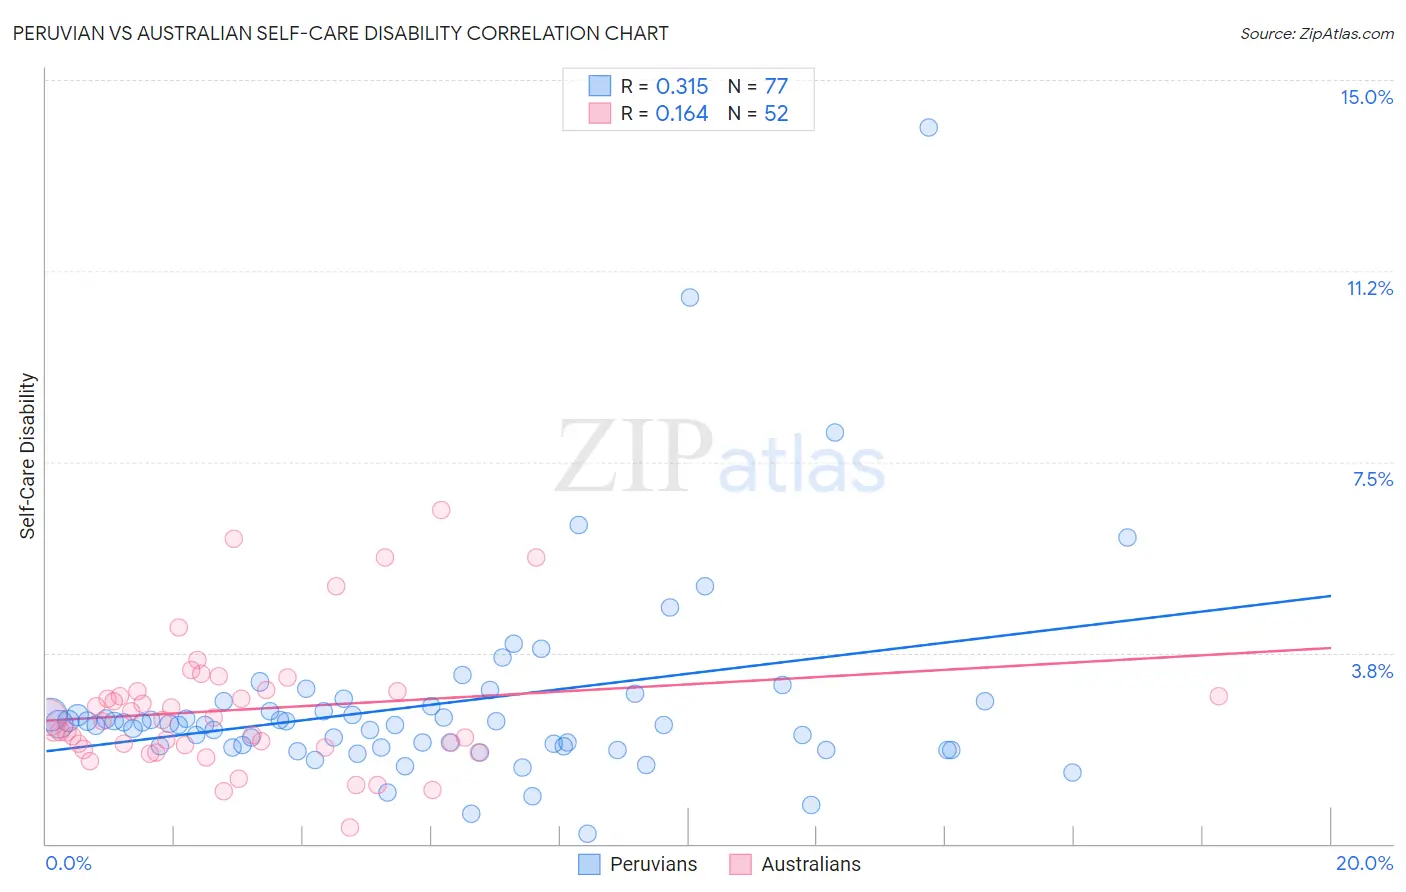
Peruvian vs Australian Self-Care Disability Correlation Chart
The statistical analysis conducted on geographies consisting of 362,873,301 people shows a mild positive correlation between the proportion of Peruvians and percentage of population with self-care disability in the United States with a correlation coefficient (R) of 0.315 and weighted average of 2.4%. Similarly, the statistical analysis conducted on geographies consisting of 223,956,744 people shows a poor positive correlation between the proportion of Australians and percentage of population with self-care disability in the United States with a correlation coefficient (R) of 0.164 and weighted average of 2.3%, a difference of 4.2%.
Self-Care Disability Correlation Summary
| Measurement | Peruvian | Australian |
| Minimum | 0.20% | 0.32% |
| Maximum | 14.1% | 6.6% |
| Range | 13.9% | 6.2% |
| Mean | 2.7% | 2.6% |
| Median | 2.3% | 2.4% |
| Interquartile 25% (IQ1) | 1.9% | 1.9% |
| Interquartile 75% (IQ3) | 2.8% | 3.0% |
| Interquartile Range (IQR) | 0.86% | 1.1% |
| Standard Deviation (Sample) | 2.0% | 1.3% |
| Standard Deviation (Population) | 2.0% | 1.3% |
Similar Demographics by Self-Care Disability
Demographics Similar to Peruvians by Self-Care Disability
In terms of self-care disability, the demographic groups most similar to Peruvians are Uruguayan (2.4%, a difference of 0.030%), Immigrants from Sierra Leone (2.4%, a difference of 0.070%), Belgian (2.4%, a difference of 0.070%), Immigrants from Canada (2.4%, a difference of 0.11%), and Immigrants from Nigeria (2.4%, a difference of 0.15%).
| Demographics | Rating | Rank | Self-Care Disability |
| Immigrants | North Macedonia | 93.1 /100 | #114 | Exceptional 2.4% |
| Immigrants | Hong Kong | 93.1 /100 | #115 | Exceptional 2.4% |
| Northern Europeans | 92.9 /100 | #116 | Exceptional 2.4% |
| Taiwanese | 92.5 /100 | #117 | Exceptional 2.4% |
| Immigrants | Canada | 92.0 /100 | #118 | Exceptional 2.4% |
| Immigrants | Sierra Leone | 91.8 /100 | #119 | Exceptional 2.4% |
| Uruguayans | 91.5 /100 | #120 | Exceptional 2.4% |
| Peruvians | 91.3 /100 | #121 | Exceptional 2.4% |
| Belgians | 90.9 /100 | #122 | Exceptional 2.4% |
| Immigrants | Nigeria | 90.3 /100 | #123 | Exceptional 2.4% |
| Immigrants | North America | 90.2 /100 | #124 | Exceptional 2.4% |
| Immigrants | Morocco | 90.2 /100 | #124 | Exceptional 2.4% |
| Hmong | 89.9 /100 | #126 | Excellent 2.4% |
| Colombians | 89.7 /100 | #127 | Excellent 2.4% |
| Immigrants | Hungary | 89.6 /100 | #128 | Excellent 2.4% |
Demographics Similar to Australians by Self-Care Disability
In terms of self-care disability, the demographic groups most similar to Australians are Immigrants from Serbia (2.3%, a difference of 0.030%), Argentinean (2.3%, a difference of 0.050%), Kenyan (2.3%, a difference of 0.060%), Immigrants from France (2.3%, a difference of 0.11%), and Immigrants from Eastern Asia (2.3%, a difference of 0.15%).
| Demographics | Rating | Rank | Self-Care Disability |
| Czechs | 99.8 /100 | #46 | Exceptional 2.3% |
| Jordanians | 99.7 /100 | #47 | Exceptional 2.3% |
| Immigrants | Malaysia | 99.7 /100 | #48 | Exceptional 2.3% |
| Latvians | 99.7 /100 | #49 | Exceptional 2.3% |
| Immigrants | Brazil | 99.7 /100 | #50 | Exceptional 2.3% |
| Kenyans | 99.7 /100 | #51 | Exceptional 2.3% |
| Immigrants | Serbia | 99.6 /100 | #52 | Exceptional 2.3% |
| Australians | 99.6 /100 | #53 | Exceptional 2.3% |
| Argentineans | 99.6 /100 | #54 | Exceptional 2.3% |
| Immigrants | France | 99.6 /100 | #55 | Exceptional 2.3% |
| Immigrants | Eastern Asia | 99.6 /100 | #56 | Exceptional 2.3% |
| Immigrants | Belgium | 99.6 /100 | #57 | Exceptional 2.3% |
| Immigrants | Cameroon | 99.6 /100 | #58 | Exceptional 2.3% |
| New Zealanders | 99.5 /100 | #59 | Exceptional 2.3% |
| Immigrants | Japan | 99.5 /100 | #60 | Exceptional 2.3% |