Tsimshian vs Hispanic or Latino Self-Care Disability
COMPARE
Tsimshian
Hispanic or Latino
Self-Care Disability
Self-Care Disability Comparison
Tsimshian
Hispanics or Latinos
2.6%
SELF-CARE DISABILITY
0.3/ 100
METRIC RATING
255th/ 347
METRIC RANK
2.7%
SELF-CARE DISABILITY
0.1/ 100
METRIC RATING
280th/ 347
METRIC RANK
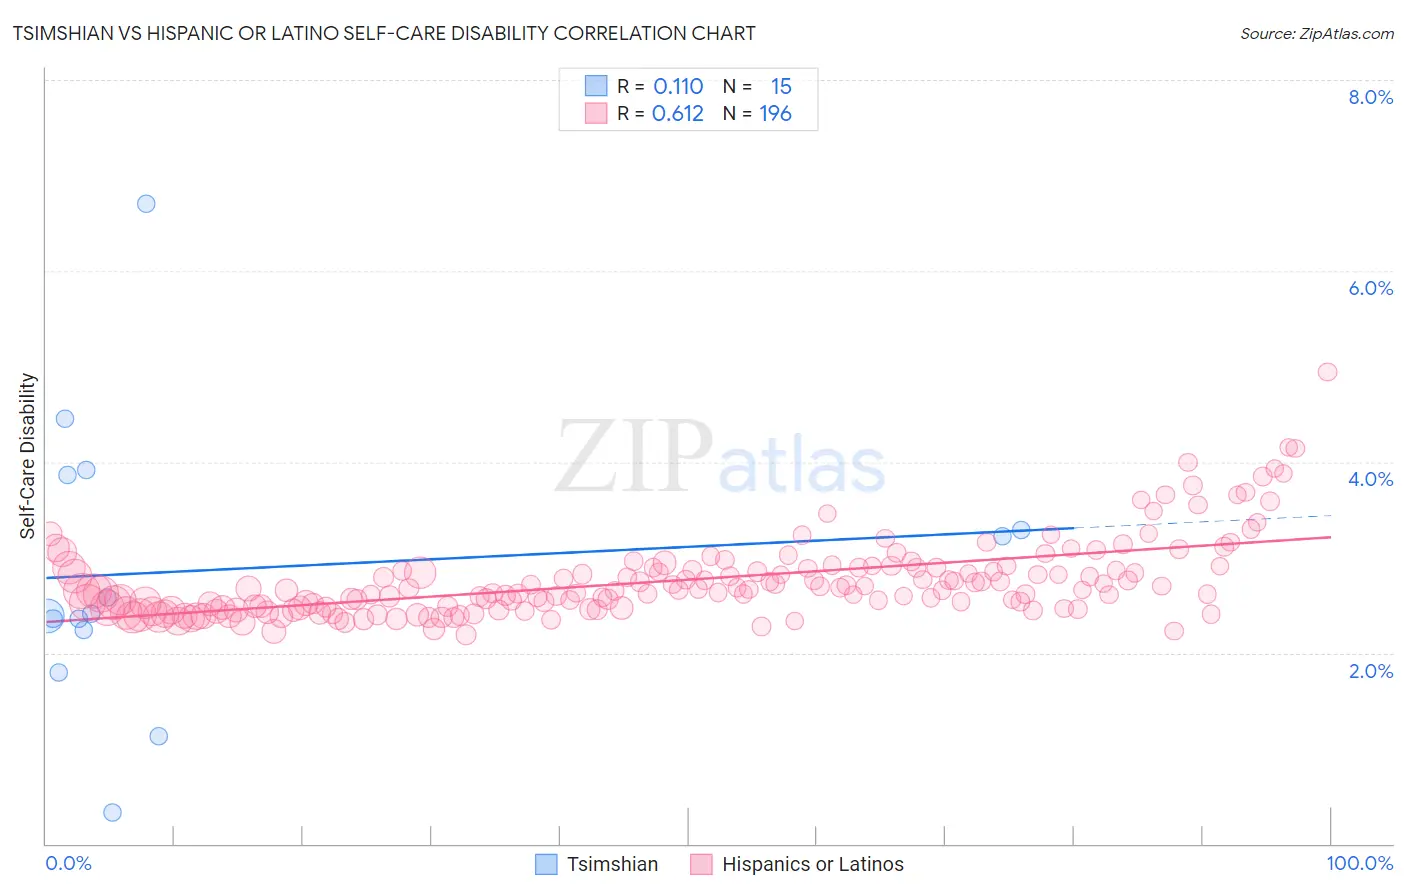
Tsimshian vs Hispanic or Latino Self-Care Disability Correlation Chart
The statistical analysis conducted on geographies consisting of 15,618,387 people shows a poor positive correlation between the proportion of Tsimshian and percentage of population with self-care disability in the United States with a correlation coefficient (R) of 0.110 and weighted average of 2.6%. Similarly, the statistical analysis conducted on geographies consisting of 571,452,222 people shows a significant positive correlation between the proportion of Hispanics or Latinos and percentage of population with self-care disability in the United States with a correlation coefficient (R) of 0.612 and weighted average of 2.7%, a difference of 2.1%.
Self-Care Disability Correlation Summary
| Measurement | Tsimshian | Hispanic or Latino |
| Minimum | 0.32% | 2.2% |
| Maximum | 6.7% | 4.9% |
| Range | 6.4% | 2.8% |
| Mean | 2.9% | 2.8% |
| Median | 2.4% | 2.7% |
| Interquartile 25% (IQ1) | 2.2% | 2.5% |
| Interquartile 75% (IQ3) | 3.9% | 2.9% |
| Interquartile Range (IQR) | 1.6% | 0.42% |
| Standard Deviation (Sample) | 1.5% | 0.41% |
| Standard Deviation (Population) | 1.5% | 0.41% |
Similar Demographics by Self-Care Disability
Demographics Similar to Tsimshian by Self-Care Disability
In terms of self-care disability, the demographic groups most similar to Tsimshian are Immigrants from Central America (2.6%, a difference of 0.020%), Haitian (2.6%, a difference of 0.040%), Immigrants from Haiti (2.6%, a difference of 0.060%), Immigrants from Bangladesh (2.6%, a difference of 0.14%), and Immigrants from Liberia (2.6%, a difference of 0.21%).
| Demographics | Rating | Rank | Self-Care Disability |
| Nicaraguans | 0.6 /100 | #248 | Tragic 2.6% |
| Mexican American Indians | 0.5 /100 | #249 | Tragic 2.6% |
| Portuguese | 0.4 /100 | #250 | Tragic 2.6% |
| Immigrants | Liberia | 0.4 /100 | #251 | Tragic 2.6% |
| Immigrants | Bangladesh | 0.4 /100 | #252 | Tragic 2.6% |
| Immigrants | Haiti | 0.3 /100 | #253 | Tragic 2.6% |
| Haitians | 0.3 /100 | #254 | Tragic 2.6% |
| Tsimshian | 0.3 /100 | #255 | Tragic 2.6% |
| Immigrants | Central America | 0.3 /100 | #256 | Tragic 2.6% |
| Potawatomi | 0.3 /100 | #257 | Tragic 2.6% |
| Immigrants | Nonimmigrants | 0.3 /100 | #258 | Tragic 2.6% |
| Immigrants | Belarus | 0.2 /100 | #259 | Tragic 2.6% |
| Chippewa | 0.2 /100 | #260 | Tragic 2.6% |
| Arapaho | 0.2 /100 | #261 | Tragic 2.6% |
| Shoshone | 0.2 /100 | #262 | Tragic 2.7% |
Demographics Similar to Hispanics or Latinos by Self-Care Disability
In terms of self-care disability, the demographic groups most similar to Hispanics or Latinos are Iroquois (2.7%, a difference of 0.020%), Ottawa (2.7%, a difference of 0.12%), Immigrants from Iraq (2.7%, a difference of 0.16%), Apache (2.7%, a difference of 0.17%), and Immigrants from Ukraine (2.7%, a difference of 0.20%).
| Demographics | Rating | Rank | Self-Care Disability |
| Mexicans | 0.1 /100 | #273 | Tragic 2.7% |
| Yakama | 0.1 /100 | #274 | Tragic 2.7% |
| Immigrants | Trinidad and Tobago | 0.1 /100 | #275 | Tragic 2.7% |
| Japanese | 0.1 /100 | #276 | Tragic 2.7% |
| Immigrants | Ukraine | 0.1 /100 | #277 | Tragic 2.7% |
| Ottawa | 0.1 /100 | #278 | Tragic 2.7% |
| Iroquois | 0.1 /100 | #279 | Tragic 2.7% |
| Hispanics or Latinos | 0.1 /100 | #280 | Tragic 2.7% |
| Immigrants | Iraq | 0.0 /100 | #281 | Tragic 2.7% |
| Apache | 0.0 /100 | #282 | Tragic 2.7% |
| Delaware | 0.0 /100 | #283 | Tragic 2.7% |
| Fijians | 0.0 /100 | #284 | Tragic 2.7% |
| Jamaicans | 0.0 /100 | #285 | Tragic 2.7% |
| French American Indians | 0.0 /100 | #286 | Tragic 2.7% |
| Immigrants | Jamaica | 0.0 /100 | #287 | Tragic 2.7% |