Swiss vs Subsaharan African Female Disability
COMPARE
Swiss
Subsaharan African
Female Disability
Female Disability Comparison
Swiss
Sub-Saharan Africans
12.4%
FEMALE DISABILITY
14.9/ 100
METRIC RATING
210th/ 347
METRIC RANK
12.7%
FEMALE DISABILITY
1.0/ 100
METRIC RATING
260th/ 347
METRIC RANK
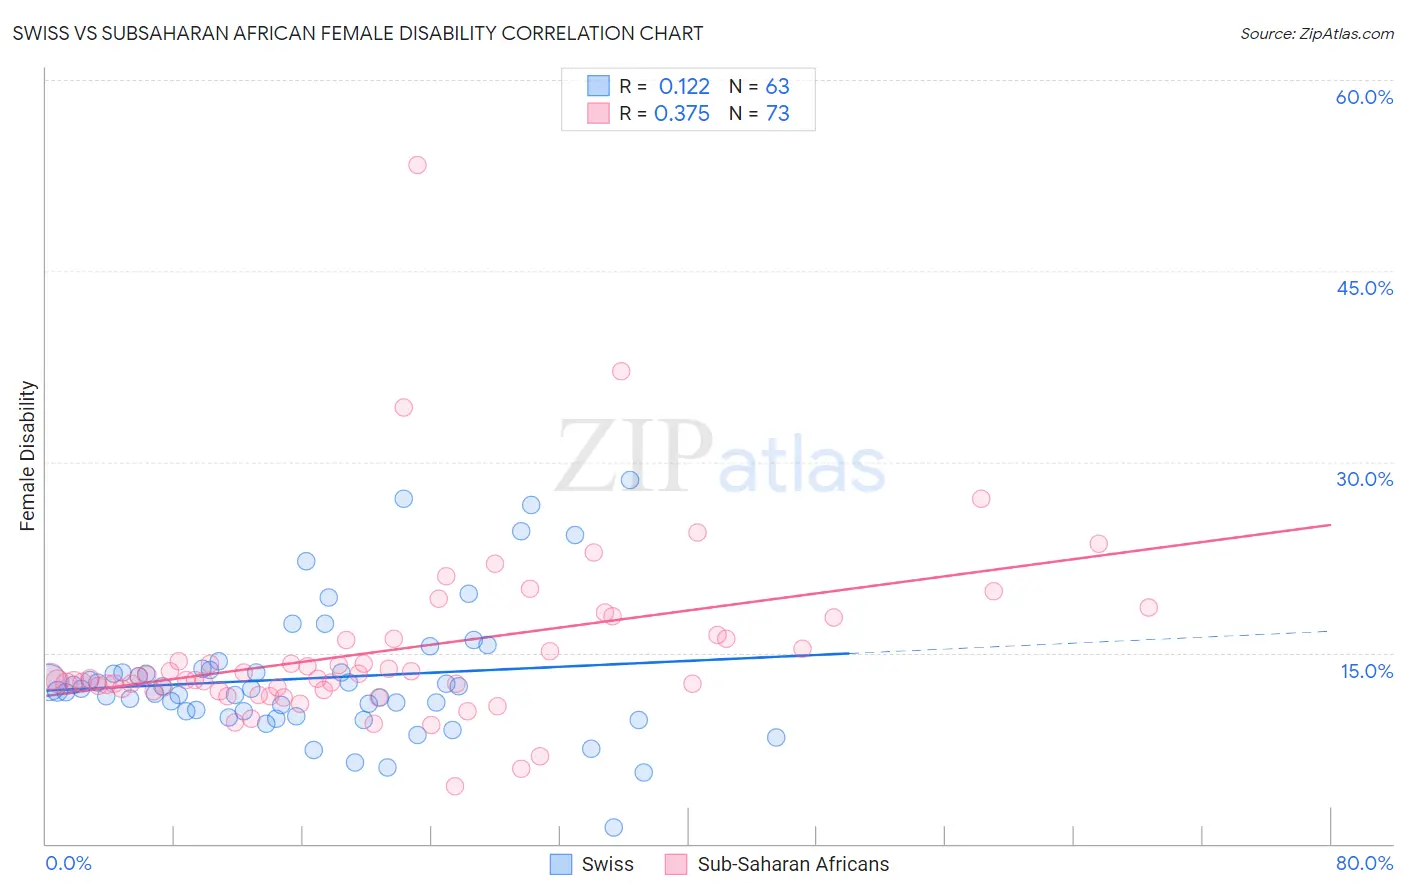
Swiss vs Subsaharan African Female Disability Correlation Chart
The statistical analysis conducted on geographies consisting of 464,961,657 people shows a poor positive correlation between the proportion of Swiss and percentage of females with a disability in the United States with a correlation coefficient (R) of 0.122 and weighted average of 12.4%. Similarly, the statistical analysis conducted on geographies consisting of 508,044,435 people shows a mild positive correlation between the proportion of Sub-Saharan Africans and percentage of females with a disability in the United States with a correlation coefficient (R) of 0.375 and weighted average of 12.7%, a difference of 2.6%.
Female Disability Correlation Summary
| Measurement | Swiss | Subsaharan African |
| Minimum | 1.3% | 4.5% |
| Maximum | 28.6% | 53.3% |
| Range | 27.3% | 48.8% |
| Mean | 13.0% | 15.1% |
| Median | 12.1% | 12.9% |
| Interquartile 25% (IQ1) | 10.4% | 12.1% |
| Interquartile 75% (IQ3) | 13.7% | 16.1% |
| Interquartile Range (IQR) | 3.3% | 4.0% |
| Standard Deviation (Sample) | 5.1% | 7.0% |
| Standard Deviation (Population) | 5.1% | 7.0% |
Similar Demographics by Female Disability
Demographics Similar to Swiss by Female Disability
In terms of female disability, the demographic groups most similar to Swiss are Immigrants from Bosnia and Herzegovina (12.4%, a difference of 0.010%), Ute (12.4%, a difference of 0.010%), Immigrants from Thailand (12.4%, a difference of 0.030%), Mexican (12.4%, a difference of 0.050%), and Panamanian (12.4%, a difference of 0.11%).
| Demographics | Rating | Rank | Female Disability |
| Immigrants | Barbados | 21.1 /100 | #203 | Fair 12.3% |
| Immigrants | Zaire | 20.9 /100 | #204 | Fair 12.3% |
| Immigrants | Grenada | 20.5 /100 | #205 | Fair 12.4% |
| Immigrants | Cuba | 20.2 /100 | #206 | Fair 12.4% |
| Croatians | 20.2 /100 | #207 | Fair 12.4% |
| Basques | 17.5 /100 | #208 | Poor 12.4% |
| Mexicans | 15.7 /100 | #209 | Poor 12.4% |
| Swiss | 14.9 /100 | #210 | Poor 12.4% |
| Immigrants | Bosnia and Herzegovina | 14.8 /100 | #211 | Poor 12.4% |
| Ute | 14.7 /100 | #212 | Poor 12.4% |
| Immigrants | Thailand | 14.5 /100 | #213 | Poor 12.4% |
| Panamanians | 13.5 /100 | #214 | Poor 12.4% |
| Samoans | 13.4 /100 | #215 | Poor 12.4% |
| Immigrants | Burma/Myanmar | 13.3 /100 | #216 | Poor 12.4% |
| British | 12.7 /100 | #217 | Poor 12.4% |
Demographics Similar to Sub-Saharan Africans by Female Disability
In terms of female disability, the demographic groups most similar to Sub-Saharan Africans are Immigrants from Armenia (12.7%, a difference of 0.010%), Bermudan (12.7%, a difference of 0.040%), Aleut (12.7%, a difference of 0.090%), Liberian (12.7%, a difference of 0.10%), and Czechoslovakian (12.7%, a difference of 0.11%).
| Demographics | Rating | Rank | Female Disability |
| Jamaicans | 1.4 /100 | #253 | Tragic 12.7% |
| Hawaiians | 1.4 /100 | #254 | Tragic 12.7% |
| Immigrants | Germany | 1.3 /100 | #255 | Tragic 12.7% |
| British West Indians | 1.2 /100 | #256 | Tragic 12.7% |
| Liberians | 1.1 /100 | #257 | Tragic 12.7% |
| Aleuts | 1.1 /100 | #258 | Tragic 12.7% |
| Immigrants | Armenia | 1.0 /100 | #259 | Tragic 12.7% |
| Sub-Saharan Africans | 1.0 /100 | #260 | Tragic 12.7% |
| Bermudans | 1.0 /100 | #261 | Tragic 12.7% |
| Czechoslovakians | 0.9 /100 | #262 | Tragic 12.7% |
| Spaniards | 0.7 /100 | #263 | Tragic 12.8% |
| Alaska Natives | 0.6 /100 | #264 | Tragic 12.8% |
| West Indians | 0.5 /100 | #265 | Tragic 12.8% |
| Finns | 0.4 /100 | #266 | Tragic 12.8% |
| Senegalese | 0.4 /100 | #267 | Tragic 12.8% |