Tlingit-Haida vs Subsaharan African Unemployment Among Ages 45 to 54 years
COMPARE
Tlingit-Haida
Subsaharan African
Unemployment Among Ages 45 to 54 years
Unemployment Among Ages 45 to 54 years Comparison
Tlingit-Haida
Sub-Saharan Africans
4.7%
UNEMPLOYMENT AMONG AGES 45 TO 54 YEARS
2.3/ 100
METRIC RATING
236th/ 347
METRIC RANK
4.9%
UNEMPLOYMENT AMONG AGES 45 TO 54 YEARS
0.2/ 100
METRIC RATING
258th/ 347
METRIC RANK
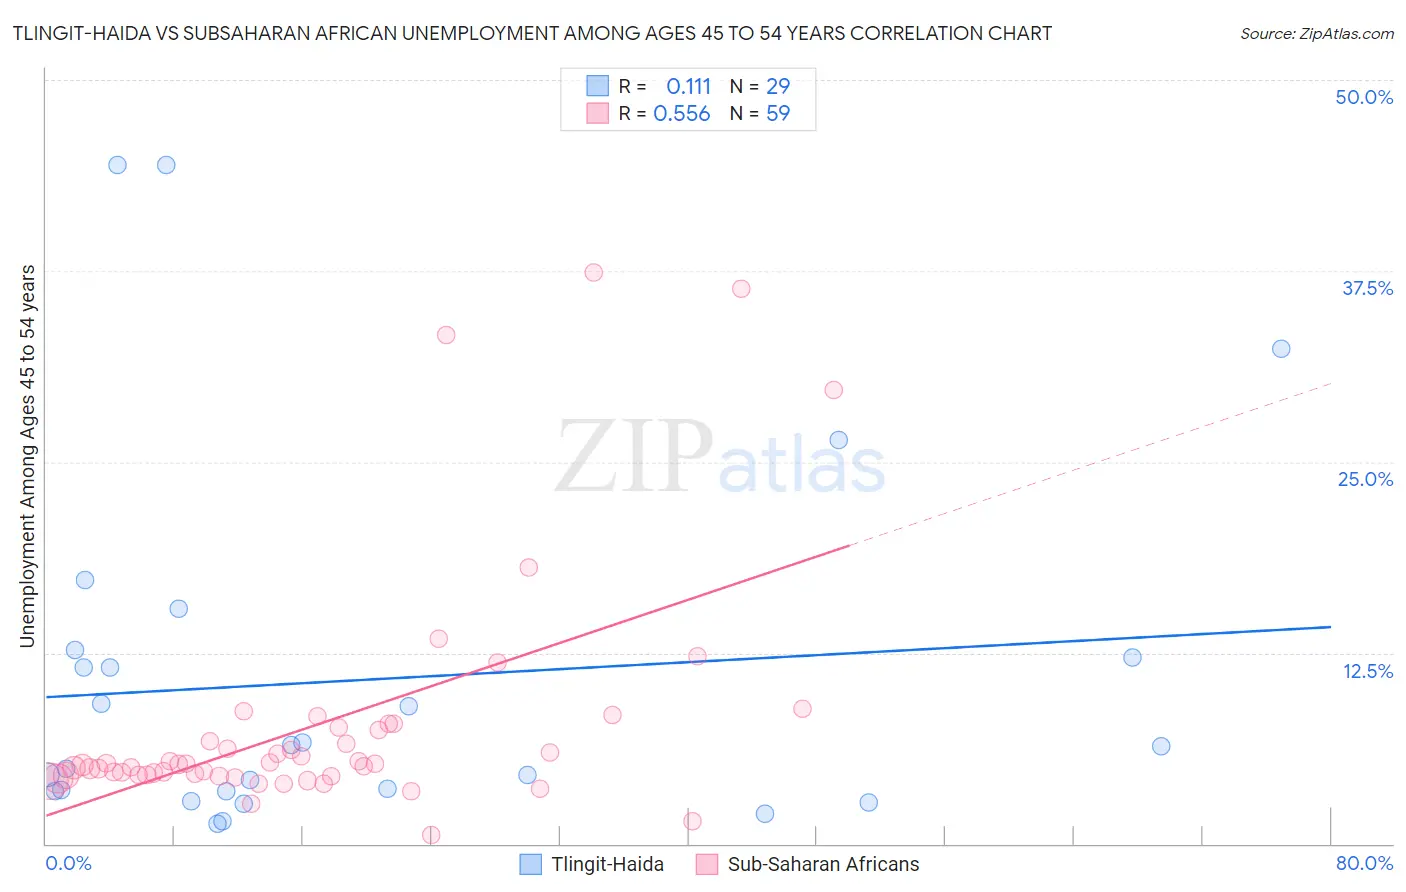
Tlingit-Haida vs Subsaharan African Unemployment Among Ages 45 to 54 years Correlation Chart
The statistical analysis conducted on geographies consisting of 60,127,685 people shows a poor positive correlation between the proportion of Tlingit-Haida and unemployment rate among population between the ages 45 and 54 in the United States with a correlation coefficient (R) of 0.111 and weighted average of 4.7%. Similarly, the statistical analysis conducted on geographies consisting of 486,803,720 people shows a substantial positive correlation between the proportion of Sub-Saharan Africans and unemployment rate among population between the ages 45 and 54 in the United States with a correlation coefficient (R) of 0.556 and weighted average of 4.9%, a difference of 2.9%.
Unemployment Among Ages 45 to 54 years Correlation Summary
| Measurement | Tlingit-Haida | Subsaharan African |
| Minimum | 1.3% | 0.60% |
| Maximum | 44.4% | 37.4% |
| Range | 43.1% | 36.8% |
| Mean | 10.7% | 7.8% |
| Median | 6.4% | 5.2% |
| Interquartile 25% (IQ1) | 3.4% | 4.5% |
| Interquartile 75% (IQ3) | 12.4% | 7.6% |
| Interquartile Range (IQR) | 9.0% | 3.1% |
| Standard Deviation (Sample) | 11.8% | 7.7% |
| Standard Deviation (Population) | 11.6% | 7.7% |
Similar Demographics by Unemployment Among Ages 45 to 54 years
Demographics Similar to Tlingit-Haida by Unemployment Among Ages 45 to 54 years
In terms of unemployment among ages 45 to 54 years, the demographic groups most similar to Tlingit-Haida are Cree (4.7%, a difference of 0.010%), Soviet Union (4.7%, a difference of 0.16%), Immigrants (4.7%, a difference of 0.18%), Ottawa (4.7%, a difference of 0.21%), and Immigrants from Ireland (4.7%, a difference of 0.22%).
| Demographics | Rating | Rank | Unemployment Among Ages 45 to 54 years |
| Immigrants | Israel | 3.0 /100 | #229 | Tragic 4.7% |
| Japanese | 2.8 /100 | #230 | Tragic 4.7% |
| Immigrants | Ireland | 2.7 /100 | #231 | Tragic 4.7% |
| Ottawa | 2.7 /100 | #232 | Tragic 4.7% |
| Immigrants | Immigrants | 2.6 /100 | #233 | Tragic 4.7% |
| Soviet Union | 2.6 /100 | #234 | Tragic 4.7% |
| Cree | 2.3 /100 | #235 | Tragic 4.7% |
| Tlingit-Haida | 2.3 /100 | #236 | Tragic 4.7% |
| Alsatians | 1.6 /100 | #237 | Tragic 4.7% |
| Yaqui | 1.4 /100 | #238 | Tragic 4.7% |
| Spanish Americans | 1.4 /100 | #239 | Tragic 4.7% |
| Immigrants | Iraq | 1.3 /100 | #240 | Tragic 4.7% |
| Delaware | 1.3 /100 | #241 | Tragic 4.8% |
| Central Americans | 1.3 /100 | #242 | Tragic 4.8% |
| Portuguese | 1.1 /100 | #243 | Tragic 4.8% |
Demographics Similar to Sub-Saharan Africans by Unemployment Among Ages 45 to 54 years
In terms of unemployment among ages 45 to 54 years, the demographic groups most similar to Sub-Saharan Africans are Immigrants from Western Africa (4.9%, a difference of 0.030%), Ugandan (4.9%, a difference of 0.15%), Mexican American Indian (4.9%, a difference of 0.16%), Guatemalan (4.9%, a difference of 0.17%), and Immigrants from Western Asia (4.8%, a difference of 0.18%).
| Demographics | Rating | Rank | Unemployment Among Ages 45 to 54 years |
| Hondurans | 0.4 /100 | #251 | Tragic 4.8% |
| Immigrants | Bahamas | 0.3 /100 | #252 | Tragic 4.8% |
| Moroccans | 0.3 /100 | #253 | Tragic 4.8% |
| Immigrants | Lebanon | 0.2 /100 | #254 | Tragic 4.8% |
| Immigrants | El Salvador | 0.2 /100 | #255 | Tragic 4.8% |
| Immigrants | Western Asia | 0.2 /100 | #256 | Tragic 4.8% |
| Immigrants | Western Africa | 0.2 /100 | #257 | Tragic 4.9% |
| Sub-Saharan Africans | 0.2 /100 | #258 | Tragic 4.9% |
| Ugandans | 0.1 /100 | #259 | Tragic 4.9% |
| Mexican American Indians | 0.1 /100 | #260 | Tragic 4.9% |
| Guatemalans | 0.1 /100 | #261 | Tragic 4.9% |
| Mexicans | 0.1 /100 | #262 | Tragic 4.9% |
| Immigrants | Fiji | 0.1 /100 | #263 | Tragic 4.9% |
| Immigrants | Guatemala | 0.1 /100 | #264 | Tragic 4.9% |
| Immigrants | Somalia | 0.1 /100 | #265 | Tragic 4.9% |