Mexican American Indian vs Subsaharan African Female Disability
COMPARE
Mexican American Indian
Subsaharan African
Female Disability
Female Disability Comparison
Mexican American Indians
Sub-Saharan Africans
12.3%
FEMALE DISABILITY
24.9/ 100
METRIC RATING
198th/ 347
METRIC RANK
12.7%
FEMALE DISABILITY
1.0/ 100
METRIC RATING
260th/ 347
METRIC RANK
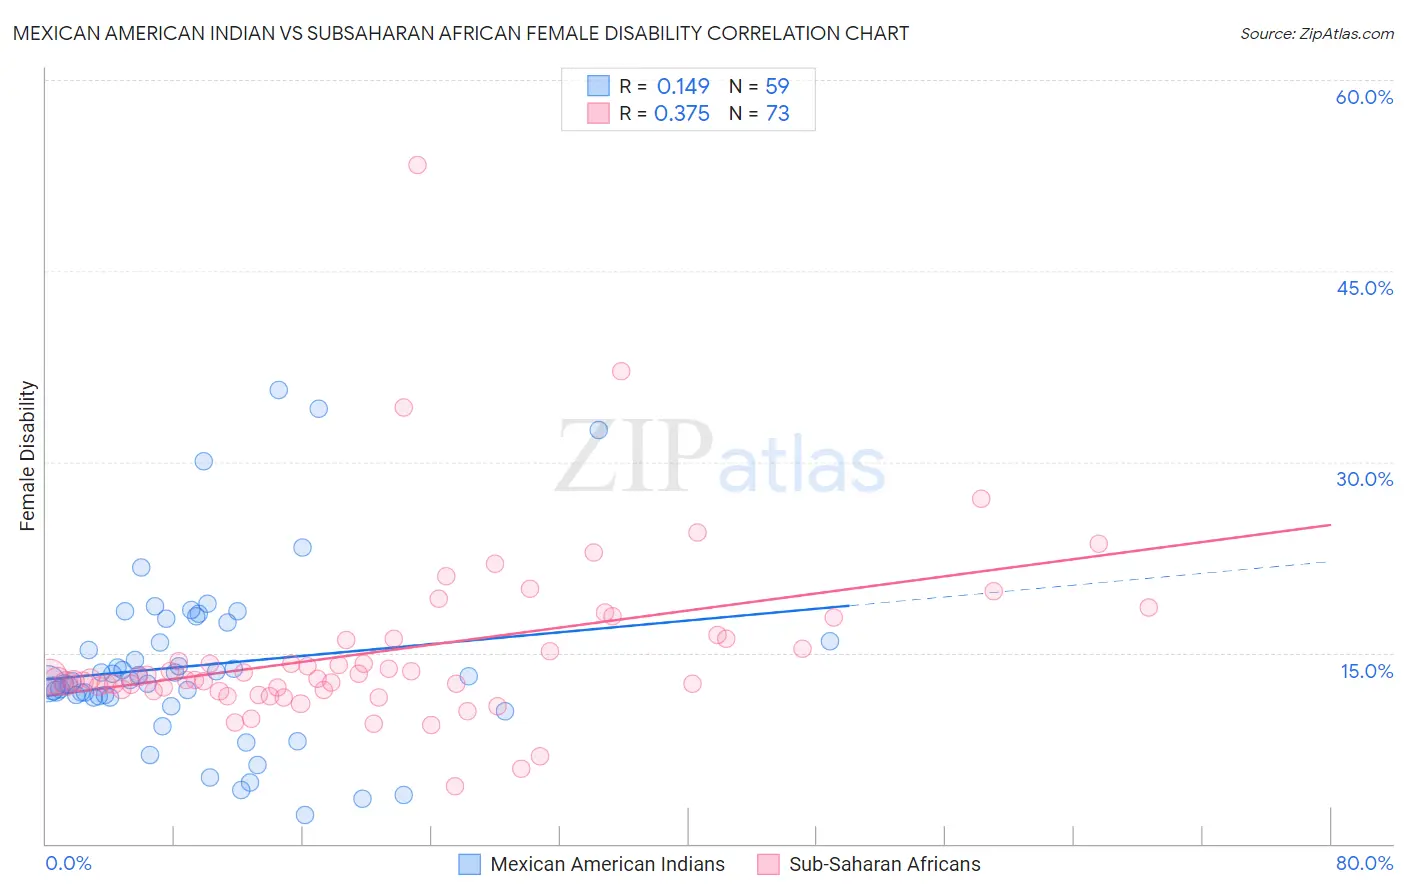
Mexican American Indian vs Subsaharan African Female Disability Correlation Chart
The statistical analysis conducted on geographies consisting of 317,566,879 people shows a poor positive correlation between the proportion of Mexican American Indians and percentage of females with a disability in the United States with a correlation coefficient (R) of 0.149 and weighted average of 12.3%. Similarly, the statistical analysis conducted on geographies consisting of 508,044,435 people shows a mild positive correlation between the proportion of Sub-Saharan Africans and percentage of females with a disability in the United States with a correlation coefficient (R) of 0.375 and weighted average of 12.7%, a difference of 3.3%.
Female Disability Correlation Summary
| Measurement | Mexican American Indian | Subsaharan African |
| Minimum | 2.3% | 4.5% |
| Maximum | 35.6% | 53.3% |
| Range | 33.3% | 48.8% |
| Mean | 14.0% | 15.1% |
| Median | 12.8% | 12.9% |
| Interquartile 25% (IQ1) | 11.5% | 12.1% |
| Interquartile 75% (IQ3) | 17.3% | 16.1% |
| Interquartile Range (IQR) | 5.8% | 4.0% |
| Standard Deviation (Sample) | 6.8% | 7.0% |
| Standard Deviation (Population) | 6.8% | 7.0% |
Similar Demographics by Female Disability
Demographics Similar to Mexican American Indians by Female Disability
In terms of female disability, the demographic groups most similar to Mexican American Indians are Immigrants from Trinidad and Tobago (12.3%, a difference of 0.010%), Immigrants from Panama (12.3%, a difference of 0.030%), Honduran (12.3%, a difference of 0.030%), Swedish (12.3%, a difference of 0.080%), and Ukrainian (12.3%, a difference of 0.11%).
| Demographics | Rating | Rank | Female Disability |
| Armenians | 29.7 /100 | #191 | Fair 12.3% |
| Immigrants | Western Africa | 29.2 /100 | #192 | Fair 12.3% |
| Northern Europeans | 27.5 /100 | #193 | Fair 12.3% |
| Ukrainians | 27.2 /100 | #194 | Fair 12.3% |
| Swedes | 26.6 /100 | #195 | Fair 12.3% |
| Immigrants | Panama | 25.5 /100 | #196 | Fair 12.3% |
| Hondurans | 25.4 /100 | #197 | Fair 12.3% |
| Mexican American Indians | 24.9 /100 | #198 | Fair 12.3% |
| Immigrants | Trinidad and Tobago | 24.7 /100 | #199 | Fair 12.3% |
| Trinidadians and Tobagonians | 22.4 /100 | #200 | Fair 12.3% |
| Chinese | 22.1 /100 | #201 | Fair 12.3% |
| Somalis | 21.5 /100 | #202 | Fair 12.3% |
| Immigrants | Barbados | 21.1 /100 | #203 | Fair 12.3% |
| Immigrants | Zaire | 20.9 /100 | #204 | Fair 12.3% |
| Immigrants | Grenada | 20.5 /100 | #205 | Fair 12.4% |
Demographics Similar to Sub-Saharan Africans by Female Disability
In terms of female disability, the demographic groups most similar to Sub-Saharan Africans are Immigrants from Armenia (12.7%, a difference of 0.010%), Bermudan (12.7%, a difference of 0.040%), Aleut (12.7%, a difference of 0.090%), Liberian (12.7%, a difference of 0.10%), and Czechoslovakian (12.7%, a difference of 0.11%).
| Demographics | Rating | Rank | Female Disability |
| Jamaicans | 1.4 /100 | #253 | Tragic 12.7% |
| Hawaiians | 1.4 /100 | #254 | Tragic 12.7% |
| Immigrants | Germany | 1.3 /100 | #255 | Tragic 12.7% |
| British West Indians | 1.2 /100 | #256 | Tragic 12.7% |
| Liberians | 1.1 /100 | #257 | Tragic 12.7% |
| Aleuts | 1.1 /100 | #258 | Tragic 12.7% |
| Immigrants | Armenia | 1.0 /100 | #259 | Tragic 12.7% |
| Sub-Saharan Africans | 1.0 /100 | #260 | Tragic 12.7% |
| Bermudans | 1.0 /100 | #261 | Tragic 12.7% |
| Czechoslovakians | 0.9 /100 | #262 | Tragic 12.7% |
| Spaniards | 0.7 /100 | #263 | Tragic 12.8% |
| Alaska Natives | 0.6 /100 | #264 | Tragic 12.8% |
| West Indians | 0.5 /100 | #265 | Tragic 12.8% |
| Finns | 0.4 /100 | #266 | Tragic 12.8% |
| Senegalese | 0.4 /100 | #267 | Tragic 12.8% |