Chinese vs South African Disability Age Under 5
COMPARE
Chinese
South African
Disability Age Under 5
Disability Age Under 5 Comparison
Chinese
South Africans
1.1%
DISABILITY AGE UNDER 5
97.2/ 100
METRIC RATING
90th/ 347
METRIC RANK
1.1%
DISABILITY AGE UNDER 5
98.7/ 100
METRIC RATING
68th/ 347
METRIC RANK
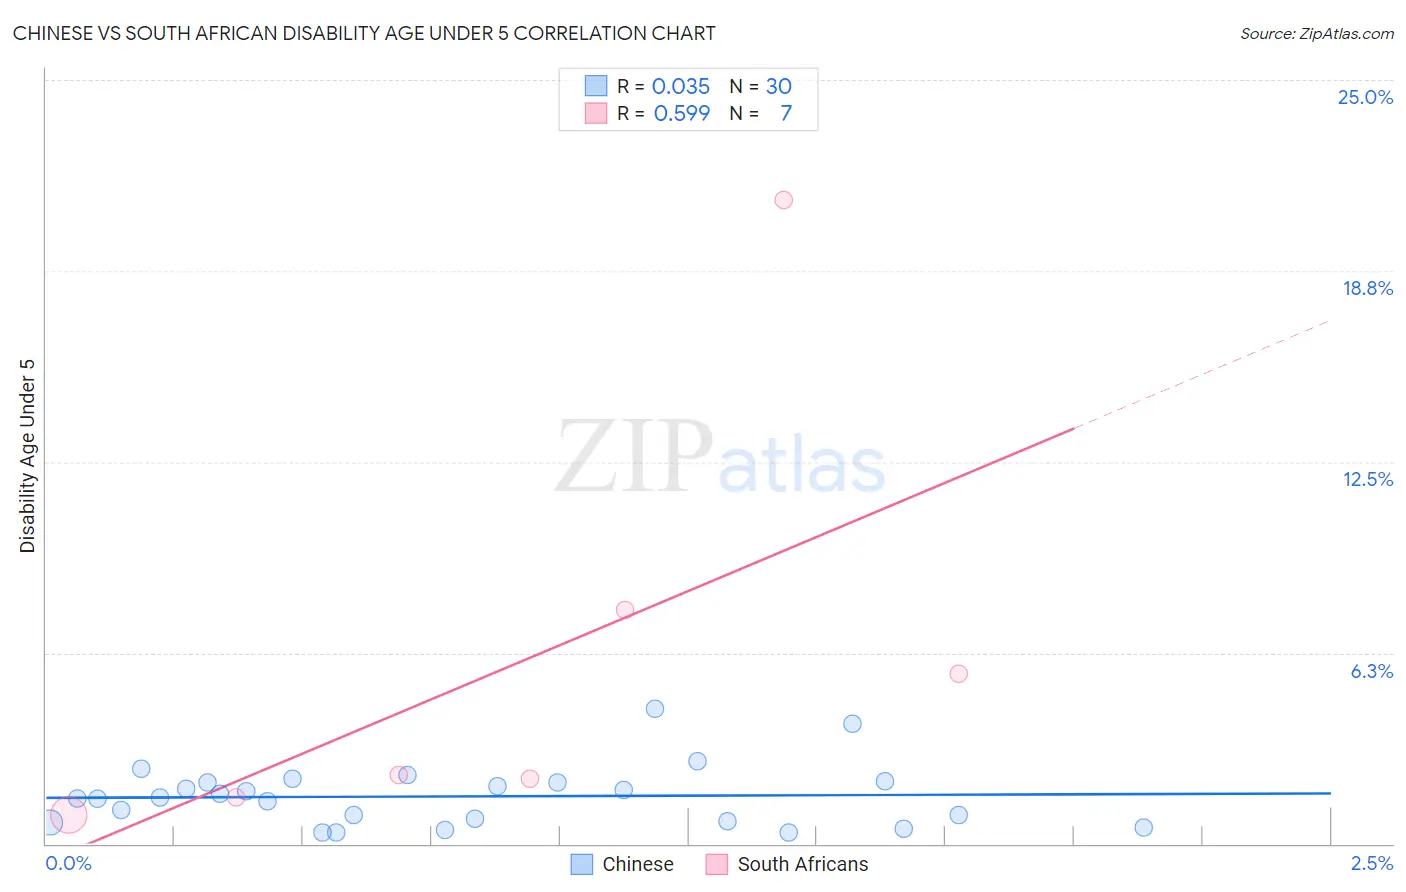
Chinese vs South African Disability Age Under 5 Correlation Chart
The statistical analysis conducted on geographies consisting of 53,046,332 people shows no correlation between the proportion of Chinese and percentage of population with a disability under the age of 5 in the United States with a correlation coefficient (R) of 0.035 and weighted average of 1.1%. Similarly, the statistical analysis conducted on geographies consisting of 120,529,150 people shows a substantial positive correlation between the proportion of South Africans and percentage of population with a disability under the age of 5 in the United States with a correlation coefficient (R) of 0.599 and weighted average of 1.1%, a difference of 1.9%.
Disability Age Under 5 Correlation Summary
| Measurement | Chinese | South African |
| Minimum | 0.35% | 0.96% |
| Maximum | 4.4% | 21.1% |
| Range | 4.0% | 20.1% |
| Mean | 1.5% | 5.9% |
| Median | 1.5% | 2.3% |
| Interquartile 25% (IQ1) | 0.75% | 1.5% |
| Interquartile 75% (IQ3) | 2.0% | 7.7% |
| Interquartile Range (IQR) | 1.3% | 6.1% |
| Standard Deviation (Sample) | 0.98% | 7.1% |
| Standard Deviation (Population) | 0.97% | 6.6% |
Similar Demographics by Disability Age Under 5
Demographics Similar to Chinese by Disability Age Under 5
In terms of disability age under 5, the demographic groups most similar to Chinese are Ethiopian (1.1%, a difference of 0.030%), Albanian (1.1%, a difference of 0.040%), Immigrants from Cuba (1.1%, a difference of 0.21%), Spanish American (1.1%, a difference of 0.24%), and Sri Lankan (1.1%, a difference of 0.30%).
| Demographics | Rating | Rank | Disability Age Under 5 |
| Immigrants | Syria | 97.9 /100 | #83 | Exceptional 1.1% |
| Immigrants | Zaire | 97.8 /100 | #84 | Exceptional 1.1% |
| Sudanese | 97.7 /100 | #85 | Exceptional 1.1% |
| Okinawans | 97.6 /100 | #86 | Exceptional 1.1% |
| Ugandans | 97.5 /100 | #87 | Exceptional 1.1% |
| Immigrants | Dominican Republic | 97.5 /100 | #88 | Exceptional 1.1% |
| Ethiopians | 97.2 /100 | #89 | Exceptional 1.1% |
| Chinese | 97.2 /100 | #90 | Exceptional 1.1% |
| Albanians | 97.2 /100 | #91 | Exceptional 1.1% |
| Immigrants | Cuba | 97.0 /100 | #92 | Exceptional 1.1% |
| Spanish Americans | 96.9 /100 | #93 | Exceptional 1.1% |
| Sri Lankans | 96.8 /100 | #94 | Exceptional 1.1% |
| Immigrants | Moldova | 96.8 /100 | #95 | Exceptional 1.1% |
| Mongolians | 96.6 /100 | #96 | Exceptional 1.1% |
| Immigrants | Iraq | 96.5 /100 | #97 | Exceptional 1.1% |
Demographics Similar to South Africans by Disability Age Under 5
In terms of disability age under 5, the demographic groups most similar to South Africans are Israeli (1.1%, a difference of 0.030%), Immigrants from Belize (1.1%, a difference of 0.040%), Immigrants from Indonesia (1.1%, a difference of 0.10%), Immigrants from Ecuador (1.1%, a difference of 0.11%), and Trinidadian and Tobagonian (1.1%, a difference of 0.17%).
| Demographics | Rating | Rank | Disability Age Under 5 |
| Immigrants | Ethiopia | 99.2 /100 | #61 | Exceptional 1.1% |
| Immigrants | Switzerland | 99.2 /100 | #62 | Exceptional 1.1% |
| Immigrants | Vietnam | 99.1 /100 | #63 | Exceptional 1.1% |
| Egyptians | 98.9 /100 | #64 | Exceptional 1.1% |
| Immigrants | Korea | 98.8 /100 | #65 | Exceptional 1.1% |
| Immigrants | Indonesia | 98.7 /100 | #66 | Exceptional 1.1% |
| Immigrants | Belize | 98.7 /100 | #67 | Exceptional 1.1% |
| South Africans | 98.7 /100 | #68 | Exceptional 1.1% |
| Israelis | 98.7 /100 | #69 | Exceptional 1.1% |
| Immigrants | Ecuador | 98.6 /100 | #70 | Exceptional 1.1% |
| Trinidadians and Tobagonians | 98.6 /100 | #71 | Exceptional 1.1% |
| Burmese | 98.5 /100 | #72 | Exceptional 1.1% |
| Immigrants | Sri Lanka | 98.5 /100 | #73 | Exceptional 1.1% |
| Jordanians | 98.5 /100 | #74 | Exceptional 1.1% |
| Immigrants | Pakistan | 98.4 /100 | #75 | Exceptional 1.1% |