Nigerian vs South African Disability Age Under 5
COMPARE
Nigerian
South African
Disability Age Under 5
Disability Age Under 5 Comparison
Nigerians
South Africans
1.3%
DISABILITY AGE UNDER 5
21.2/ 100
METRIC RATING
207th/ 347
METRIC RANK
1.1%
DISABILITY AGE UNDER 5
98.7/ 100
METRIC RATING
68th/ 347
METRIC RANK
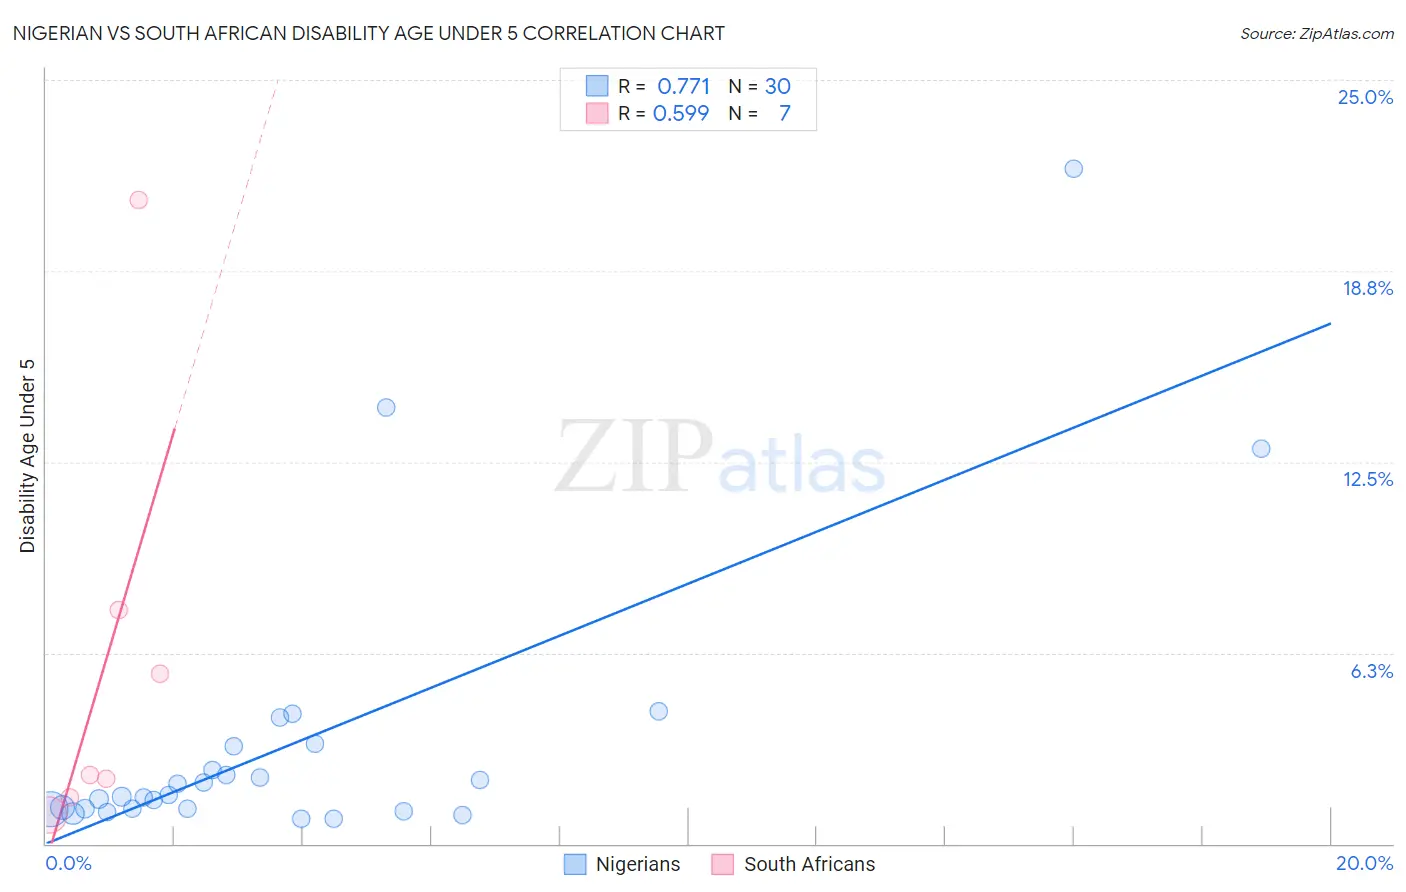
Nigerian vs South African Disability Age Under 5 Correlation Chart
The statistical analysis conducted on geographies consisting of 194,464,110 people shows a strong positive correlation between the proportion of Nigerians and percentage of population with a disability under the age of 5 in the United States with a correlation coefficient (R) of 0.771 and weighted average of 1.3%. Similarly, the statistical analysis conducted on geographies consisting of 120,529,150 people shows a substantial positive correlation between the proportion of South Africans and percentage of population with a disability under the age of 5 in the United States with a correlation coefficient (R) of 0.599 and weighted average of 1.1%, a difference of 14.1%.
Disability Age Under 5 Correlation Summary
| Measurement | Nigerian | South African |
| Minimum | 0.82% | 0.96% |
| Maximum | 22.1% | 21.1% |
| Range | 21.3% | 20.1% |
| Mean | 3.3% | 5.9% |
| Median | 1.6% | 2.3% |
| Interquartile 25% (IQ1) | 1.2% | 1.5% |
| Interquartile 75% (IQ3) | 3.2% | 7.7% |
| Interquartile Range (IQR) | 2.0% | 6.1% |
| Standard Deviation (Sample) | 4.7% | 7.1% |
| Standard Deviation (Population) | 4.7% | 6.6% |
Similar Demographics by Disability Age Under 5
Demographics Similar to Nigerians by Disability Age Under 5
In terms of disability age under 5, the demographic groups most similar to Nigerians are Mexican (1.3%, a difference of 0.060%), Immigrants from Poland (1.3%, a difference of 0.15%), Romanian (1.3%, a difference of 0.17%), Bulgarian (1.3%, a difference of 0.23%), and Pakistani (1.3%, a difference of 0.24%).
| Demographics | Rating | Rank | Disability Age Under 5 |
| Immigrants | Lithuania | 27.2 /100 | #200 | Fair 1.3% |
| Immigrants | Italy | 25.4 /100 | #201 | Fair 1.3% |
| Arapaho | 24.1 /100 | #202 | Fair 1.3% |
| Liberians | 24.0 /100 | #203 | Fair 1.3% |
| Immigrants | Europe | 23.6 /100 | #204 | Fair 1.3% |
| Romanians | 22.5 /100 | #205 | Fair 1.3% |
| Immigrants | Poland | 22.4 /100 | #206 | Fair 1.3% |
| Nigerians | 21.2 /100 | #207 | Fair 1.3% |
| Mexicans | 20.8 /100 | #208 | Fair 1.3% |
| Bulgarians | 19.5 /100 | #209 | Poor 1.3% |
| Pakistanis | 19.4 /100 | #210 | Poor 1.3% |
| Immigrants | Greece | 19.1 /100 | #211 | Poor 1.3% |
| Chileans | 18.8 /100 | #212 | Poor 1.3% |
| Immigrants | Sudan | 18.7 /100 | #213 | Poor 1.3% |
| Immigrants | Chile | 17.2 /100 | #214 | Poor 1.3% |
Demographics Similar to South Africans by Disability Age Under 5
In terms of disability age under 5, the demographic groups most similar to South Africans are Israeli (1.1%, a difference of 0.030%), Immigrants from Belize (1.1%, a difference of 0.040%), Immigrants from Indonesia (1.1%, a difference of 0.10%), Immigrants from Ecuador (1.1%, a difference of 0.11%), and Trinidadian and Tobagonian (1.1%, a difference of 0.17%).
| Demographics | Rating | Rank | Disability Age Under 5 |
| Immigrants | Ethiopia | 99.2 /100 | #61 | Exceptional 1.1% |
| Immigrants | Switzerland | 99.2 /100 | #62 | Exceptional 1.1% |
| Immigrants | Vietnam | 99.1 /100 | #63 | Exceptional 1.1% |
| Egyptians | 98.9 /100 | #64 | Exceptional 1.1% |
| Immigrants | Korea | 98.8 /100 | #65 | Exceptional 1.1% |
| Immigrants | Indonesia | 98.7 /100 | #66 | Exceptional 1.1% |
| Immigrants | Belize | 98.7 /100 | #67 | Exceptional 1.1% |
| South Africans | 98.7 /100 | #68 | Exceptional 1.1% |
| Israelis | 98.7 /100 | #69 | Exceptional 1.1% |
| Immigrants | Ecuador | 98.6 /100 | #70 | Exceptional 1.1% |
| Trinidadians and Tobagonians | 98.6 /100 | #71 | Exceptional 1.1% |
| Burmese | 98.5 /100 | #72 | Exceptional 1.1% |
| Immigrants | Sri Lanka | 98.5 /100 | #73 | Exceptional 1.1% |
| Jordanians | 98.5 /100 | #74 | Exceptional 1.1% |
| Immigrants | Pakistan | 98.4 /100 | #75 | Exceptional 1.1% |