Estonian vs Ecuadorian Disability Age 35 to 64
COMPARE
Estonian
Ecuadorian
Disability Age 35 to 64
Disability Age 35 to 64 Comparison
Estonians
Ecuadorians
10.6%
DISABILITY AGE 35 TO 64
94.5/ 100
METRIC RATING
124th/ 347
METRIC RANK
10.7%
DISABILITY AGE 35 TO 64
93.1/ 100
METRIC RATING
129th/ 347
METRIC RANK
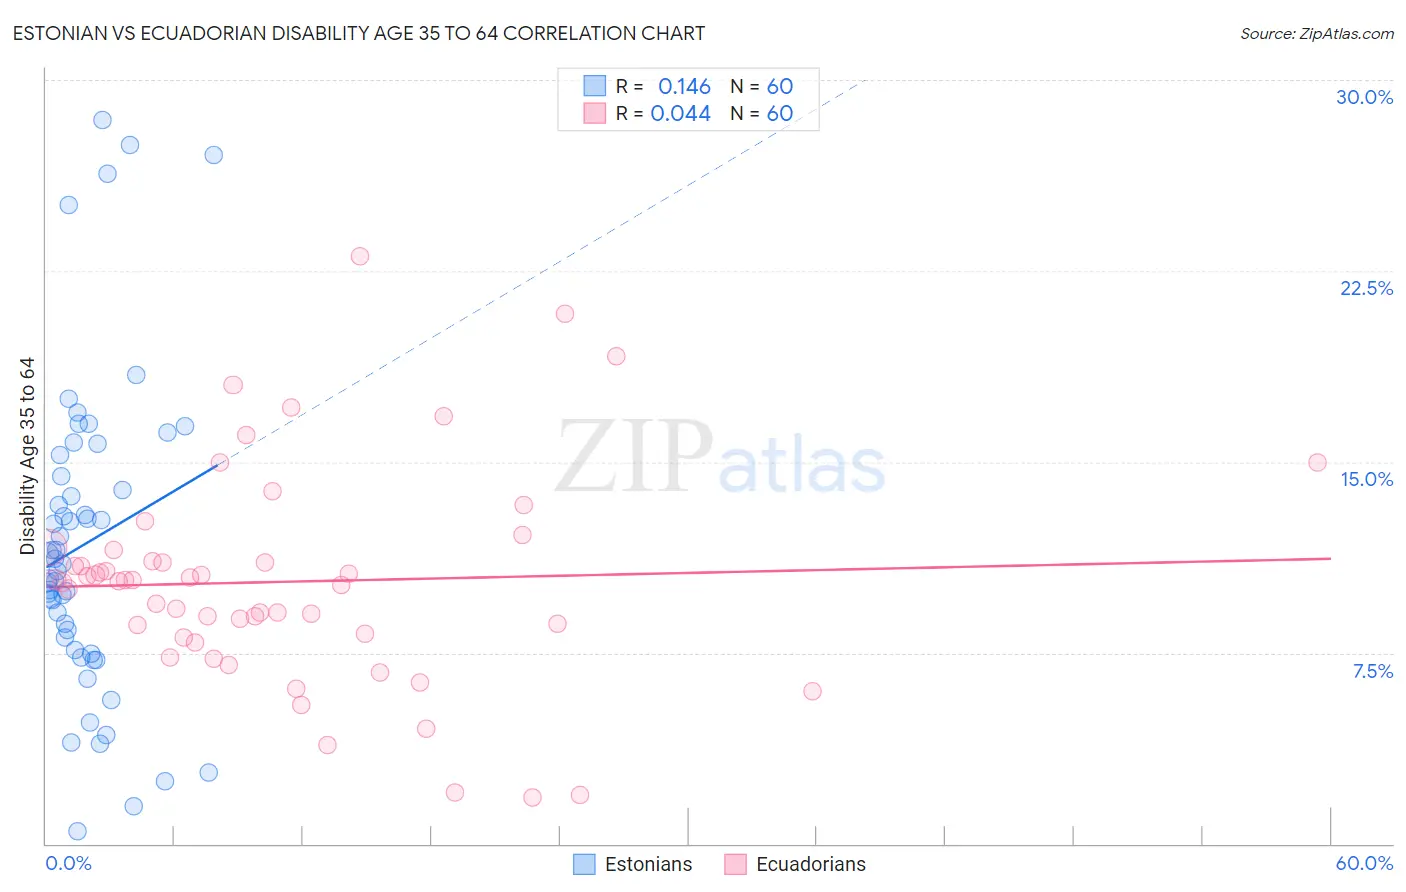
Estonian vs Ecuadorian Disability Age 35 to 64 Correlation Chart
The statistical analysis conducted on geographies consisting of 123,493,933 people shows a poor positive correlation between the proportion of Estonians and percentage of population with a disability between the ages 34 and 64 in the United States with a correlation coefficient (R) of 0.146 and weighted average of 10.6%. Similarly, the statistical analysis conducted on geographies consisting of 317,605,985 people shows no correlation between the proportion of Ecuadorians and percentage of population with a disability between the ages 34 and 64 in the United States with a correlation coefficient (R) of 0.044 and weighted average of 10.7%, a difference of 0.52%.
Disability Age 35 to 64 Correlation Summary
| Measurement | Estonian | Ecuadorian |
| Minimum | 0.48% | 1.8% |
| Maximum | 28.4% | 23.1% |
| Range | 28.0% | 21.2% |
| Mean | 11.8% | 10.3% |
| Median | 11.1% | 10.3% |
| Interquartile 25% (IQ1) | 7.9% | 8.2% |
| Interquartile 75% (IQ3) | 14.9% | 11.3% |
| Interquartile Range (IQR) | 7.0% | 3.2% |
| Standard Deviation (Sample) | 6.2% | 4.2% |
| Standard Deviation (Population) | 6.1% | 4.2% |
Demographics Similar to Estonians and Ecuadorians by Disability Age 35 to 64
In terms of disability age 35 to 64, the demographic groups most similar to Estonians are Albanian (10.6%, a difference of 0.10%), Maltese (10.6%, a difference of 0.12%), Immigrants from Afghanistan (10.6%, a difference of 0.16%), Immigrants from Zimbabwe (10.6%, a difference of 0.20%), and Immigrants from Norway (10.6%, a difference of 0.21%). Similarly, the demographic groups most similar to Ecuadorians are Immigrants from Syria (10.7%, a difference of 0.020%), South African (10.7%, a difference of 0.080%), Immigrants from El Salvador (10.7%, a difference of 0.080%), Immigrants from Albania (10.7%, a difference of 0.18%), and Immigrants (10.7%, a difference of 0.19%).
| Demographics | Rating | Rank | Disability Age 35 to 64 |
| Immigrants | Nepal | 95.9 /100 | #116 | Exceptional 10.6% |
| Immigrants | South Eastern Asia | 95.7 /100 | #117 | Exceptional 10.6% |
| Immigrants | Moldova | 95.5 /100 | #118 | Exceptional 10.6% |
| Luxembourgers | 95.5 /100 | #119 | Exceptional 10.6% |
| Vietnamese | 95.4 /100 | #120 | Exceptional 10.6% |
| Romanians | 95.0 /100 | #121 | Exceptional 10.6% |
| Immigrants | Norway | 95.0 /100 | #122 | Exceptional 10.6% |
| Maltese | 94.8 /100 | #123 | Exceptional 10.6% |
| Estonians | 94.5 /100 | #124 | Exceptional 10.6% |
| Albanians | 94.2 /100 | #125 | Exceptional 10.6% |
| Immigrants | Afghanistan | 94.1 /100 | #126 | Exceptional 10.6% |
| Immigrants | Zimbabwe | 94.0 /100 | #127 | Exceptional 10.6% |
| South Africans | 93.3 /100 | #128 | Exceptional 10.7% |
| Ecuadorians | 93.1 /100 | #129 | Exceptional 10.7% |
| Immigrants | Syria | 93.0 /100 | #130 | Exceptional 10.7% |
| Immigrants | El Salvador | 92.8 /100 | #131 | Exceptional 10.7% |
| Immigrants | Albania | 92.5 /100 | #132 | Exceptional 10.7% |
| Immigrants | Immigrants | 92.5 /100 | #133 | Exceptional 10.7% |
| Immigrants | Ecuador | 92.5 /100 | #134 | Exceptional 10.7% |
| Greeks | 92.3 /100 | #135 | Exceptional 10.7% |
| Salvadorans | 91.9 /100 | #136 | Exceptional 10.7% |