Tlingit-Haida vs Australian Master's Degree
COMPARE
Tlingit-Haida
Australian
Master's Degree
Master's Degree Comparison
Tlingit-Haida
Australians
12.8%
MASTER'S DEGREE
1.3/ 100
METRIC RATING
251st/ 347
METRIC RANK
18.4%
MASTER'S DEGREE
99.9/ 100
METRIC RATING
58th/ 347
METRIC RANK
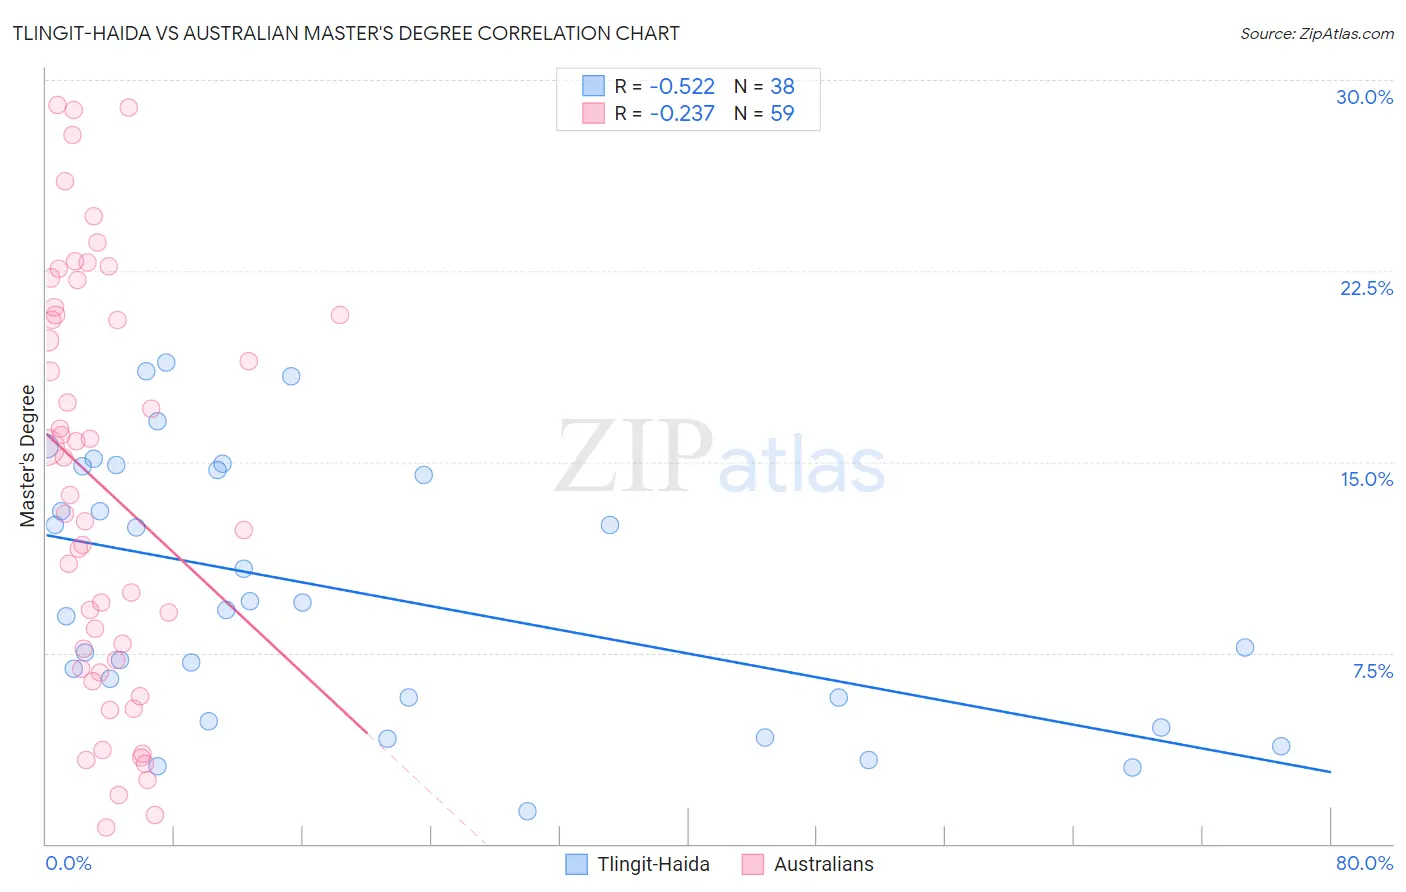
Tlingit-Haida vs Australian Master's Degree Correlation Chart
The statistical analysis conducted on geographies consisting of 60,869,548 people shows a substantial negative correlation between the proportion of Tlingit-Haida and percentage of population with at least master's degree education in the United States with a correlation coefficient (R) of -0.522 and weighted average of 12.8%. Similarly, the statistical analysis conducted on geographies consisting of 224,102,387 people shows a weak negative correlation between the proportion of Australians and percentage of population with at least master's degree education in the United States with a correlation coefficient (R) of -0.237 and weighted average of 18.4%, a difference of 43.3%.
Master's Degree Correlation Summary
| Measurement | Tlingit-Haida | Australian |
| Minimum | 1.3% | 0.65% |
| Maximum | 18.9% | 29.0% |
| Range | 17.7% | 28.4% |
| Mean | 9.9% | 14.0% |
| Median | 9.3% | 13.7% |
| Interquartile 25% (IQ1) | 5.7% | 6.9% |
| Interquartile 75% (IQ3) | 14.7% | 20.7% |
| Interquartile Range (IQR) | 8.9% | 13.9% |
| Standard Deviation (Sample) | 5.1% | 8.1% |
| Standard Deviation (Population) | 5.0% | 8.1% |
Similar Demographics by Master's Degree
Demographics Similar to Tlingit-Haida by Master's Degree
In terms of master's degree, the demographic groups most similar to Tlingit-Haida are Liberian (12.8%, a difference of 0.030%), Cree (12.8%, a difference of 0.040%), African (12.9%, a difference of 0.35%), Iroquois (12.9%, a difference of 0.43%), and Immigrants from Cambodia (12.9%, a difference of 0.47%).
| Demographics | Rating | Rank | Master's Degree |
| Delaware | 1.7 /100 | #244 | Tragic 13.0% |
| Immigrants | Bahamas | 1.4 /100 | #245 | Tragic 12.9% |
| Immigrants | Cambodia | 1.4 /100 | #246 | Tragic 12.9% |
| Iroquois | 1.4 /100 | #247 | Tragic 12.9% |
| Africans | 1.4 /100 | #248 | Tragic 12.9% |
| Cree | 1.3 /100 | #249 | Tragic 12.8% |
| Liberians | 1.3 /100 | #250 | Tragic 12.8% |
| Tlingit-Haida | 1.3 /100 | #251 | Tragic 12.8% |
| French American Indians | 1.0 /100 | #252 | Tragic 12.7% |
| Immigrants | Dominica | 0.8 /100 | #253 | Tragic 12.6% |
| Indonesians | 0.8 /100 | #254 | Tragic 12.6% |
| Immigrants | Congo | 0.8 /100 | #255 | Tragic 12.6% |
| Immigrants | Portugal | 0.8 /100 | #256 | Tragic 12.6% |
| Osage | 0.7 /100 | #257 | Tragic 12.6% |
| Immigrants | Liberia | 0.6 /100 | #258 | Tragic 12.5% |
Demographics Similar to Australians by Master's Degree
In terms of master's degree, the demographic groups most similar to Australians are Immigrants from Asia (18.4%, a difference of 0.13%), Asian (18.4%, a difference of 0.27%), Immigrants from Bulgaria (18.3%, a difference of 0.44%), Immigrants from Serbia (18.5%, a difference of 0.49%), and Immigrants from Lithuania (18.5%, a difference of 0.53%).
| Demographics | Rating | Rank | Master's Degree |
| Immigrants | South Africa | 100.0 /100 | #51 | Exceptional 18.8% |
| Immigrants | Kuwait | 100.0 /100 | #52 | Exceptional 18.6% |
| Immigrants | Czechoslovakia | 99.9 /100 | #53 | Exceptional 18.5% |
| Immigrants | Lithuania | 99.9 /100 | #54 | Exceptional 18.5% |
| Immigrants | Serbia | 99.9 /100 | #55 | Exceptional 18.5% |
| Asians | 99.9 /100 | #56 | Exceptional 18.4% |
| Immigrants | Asia | 99.9 /100 | #57 | Exceptional 18.4% |
| Australians | 99.9 /100 | #58 | Exceptional 18.4% |
| Immigrants | Bulgaria | 99.9 /100 | #59 | Exceptional 18.3% |
| New Zealanders | 99.9 /100 | #60 | Exceptional 18.3% |
| Immigrants | Europe | 99.9 /100 | #61 | Exceptional 18.2% |
| Argentineans | 99.9 /100 | #62 | Exceptional 18.2% |
| Immigrants | Netherlands | 99.9 /100 | #63 | Exceptional 18.1% |
| South Africans | 99.9 /100 | #64 | Exceptional 18.1% |
| Immigrants | Kazakhstan | 99.8 /100 | #65 | Exceptional 18.0% |