Tlingit-Haida vs Australian Median Earnings
COMPARE
Tlingit-Haida
Australian
Median Earnings
Median Earnings Comparison
Tlingit-Haida
Australians
$45,468
MEDIAN EARNINGS
20.5/ 100
METRIC RATING
217th/ 347
METRIC RANK
$52,294
MEDIAN EARNINGS
100.0/ 100
METRIC RATING
47th/ 347
METRIC RANK
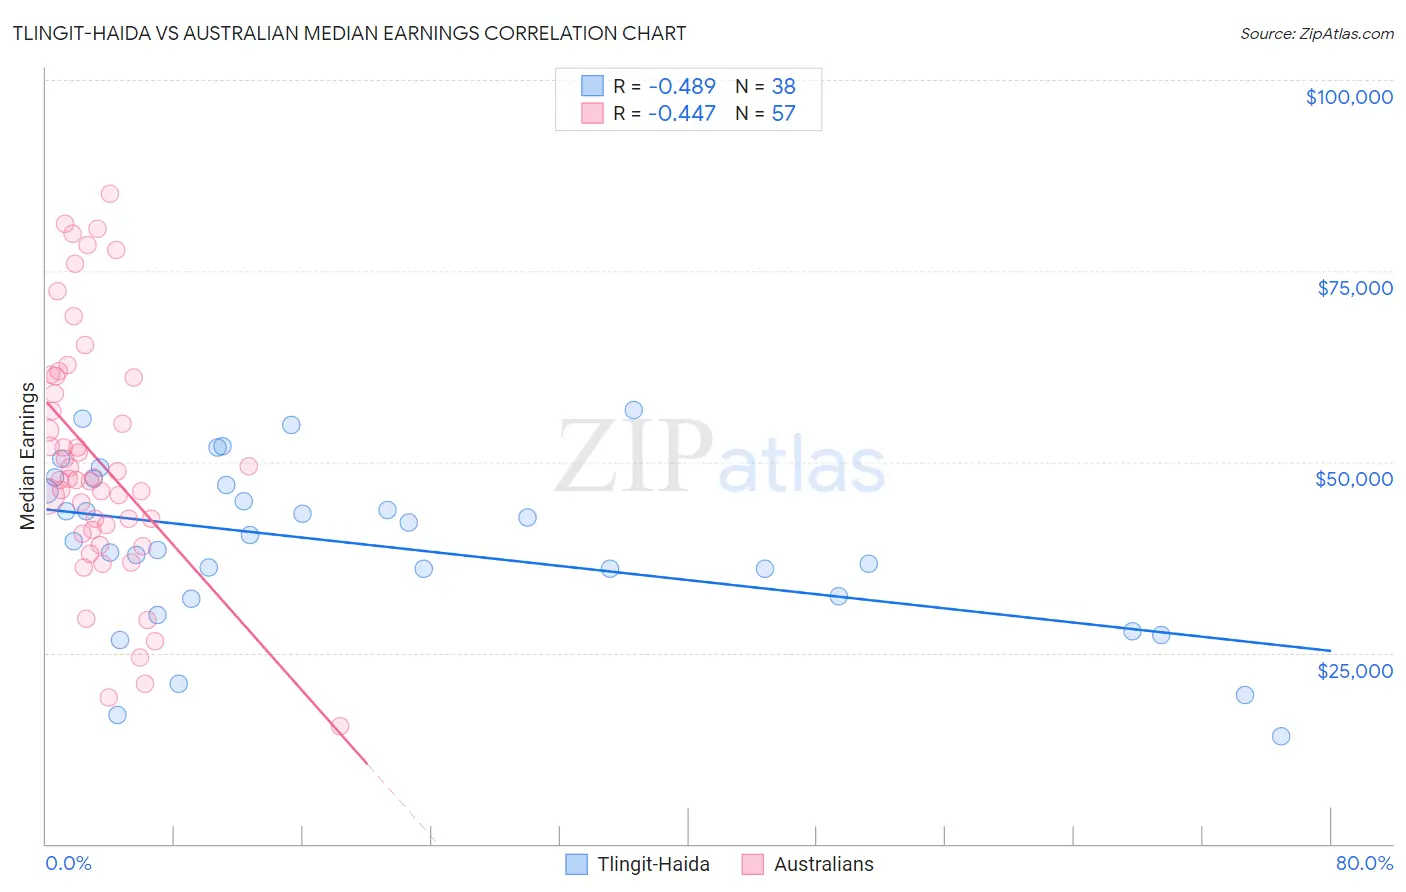
Tlingit-Haida vs Australian Median Earnings Correlation Chart
The statistical analysis conducted on geographies consisting of 60,865,073 people shows a moderate negative correlation between the proportion of Tlingit-Haida and median earnings in the United States with a correlation coefficient (R) of -0.489 and weighted average of $45,468. Similarly, the statistical analysis conducted on geographies consisting of 224,158,339 people shows a moderate negative correlation between the proportion of Australians and median earnings in the United States with a correlation coefficient (R) of -0.447 and weighted average of $52,294, a difference of 15.0%.
Median Earnings Correlation Summary
| Measurement | Tlingit-Haida | Australian |
| Minimum | $14,091 | $15,451 |
| Maximum | $56,765 | $85,069 |
| Range | $42,674 | $69,618 |
| Mean | $39,098 | $50,151 |
| Median | $40,018 | $47,849 |
| Interquartile 25% (IQ1) | $32,344 | $40,819 |
| Interquartile 75% (IQ3) | $46,917 | $61,206 |
| Interquartile Range (IQR) | $14,573 | $20,387 |
| Standard Deviation (Sample) | $10,751 | $16,224 |
| Standard Deviation (Population) | $10,609 | $16,081 |
Similar Demographics by Median Earnings
Demographics Similar to Tlingit-Haida by Median Earnings
In terms of median earnings, the demographic groups most similar to Tlingit-Haida are Guyanese ($45,470, a difference of 0.0%), Spanish ($45,432, a difference of 0.080%), Nigerian ($45,532, a difference of 0.14%), Immigrants from Bangladesh ($45,532, a difference of 0.14%), and Immigrants from Colombia ($45,550, a difference of 0.18%).
| Demographics | Rating | Rank | Median Earnings |
| Immigrants | Grenada | 23.6 /100 | #210 | Fair $45,596 |
| Panamanians | 23.5 /100 | #211 | Fair $45,593 |
| Bermudans | 23.5 /100 | #212 | Fair $45,593 |
| Immigrants | Colombia | 22.4 /100 | #213 | Fair $45,550 |
| Nigerians | 22.0 /100 | #214 | Fair $45,532 |
| Immigrants | Bangladesh | 22.0 /100 | #215 | Fair $45,532 |
| Guyanese | 20.6 /100 | #216 | Fair $45,470 |
| Tlingit-Haida | 20.5 /100 | #217 | Fair $45,468 |
| Spanish | 19.7 /100 | #218 | Poor $45,432 |
| Dutch | 18.4 /100 | #219 | Poor $45,370 |
| Ecuadorians | 15.3 /100 | #220 | Poor $45,214 |
| Immigrants | Guyana | 15.1 /100 | #221 | Poor $45,204 |
| Immigrants | Panama | 15.0 /100 | #222 | Poor $45,198 |
| Whites/Caucasians | 15.0 /100 | #223 | Poor $45,197 |
| West Indians | 13.9 /100 | #224 | Poor $45,132 |
Demographics Similar to Australians by Median Earnings
In terms of median earnings, the demographic groups most similar to Australians are Bhutanese ($52,297, a difference of 0.010%), Immigrants from Czechoslovakia ($52,361, a difference of 0.13%), Immigrants from Europe ($52,195, a difference of 0.19%), Immigrants from Malaysia ($52,514, a difference of 0.42%), and Bulgarian ($52,512, a difference of 0.42%).
| Demographics | Rating | Rank | Median Earnings |
| Israelis | 100.0 /100 | #40 | Exceptional $52,937 |
| Immigrants | Lithuania | 100.0 /100 | #41 | Exceptional $52,769 |
| Maltese | 100.0 /100 | #42 | Exceptional $52,526 |
| Immigrants | Malaysia | 100.0 /100 | #43 | Exceptional $52,514 |
| Bulgarians | 100.0 /100 | #44 | Exceptional $52,512 |
| Immigrants | Czechoslovakia | 100.0 /100 | #45 | Exceptional $52,361 |
| Bhutanese | 100.0 /100 | #46 | Exceptional $52,297 |
| Australians | 100.0 /100 | #47 | Exceptional $52,294 |
| Immigrants | Europe | 100.0 /100 | #48 | Exceptional $52,195 |
| Bolivians | 100.0 /100 | #49 | Exceptional $52,005 |
| Immigrants | South Africa | 100.0 /100 | #50 | Exceptional $51,850 |
| Immigrants | Austria | 99.9 /100 | #51 | Exceptional $51,826 |
| Estonians | 99.9 /100 | #52 | Exceptional $51,772 |
| Immigrants | Norway | 99.9 /100 | #53 | Exceptional $51,758 |
| Immigrants | Indonesia | 99.9 /100 | #54 | Exceptional $51,715 |