Syrian vs Trinidadian and Tobagonian Female Disability
COMPARE
Syrian
Trinidadian and Tobagonian
Female Disability
Female Disability Comparison
Syrians
Trinidadians and Tobagonians
12.1%
FEMALE DISABILITY
76.9/ 100
METRIC RATING
154th/ 347
METRIC RANK
12.3%
FEMALE DISABILITY
22.4/ 100
METRIC RATING
200th/ 347
METRIC RANK
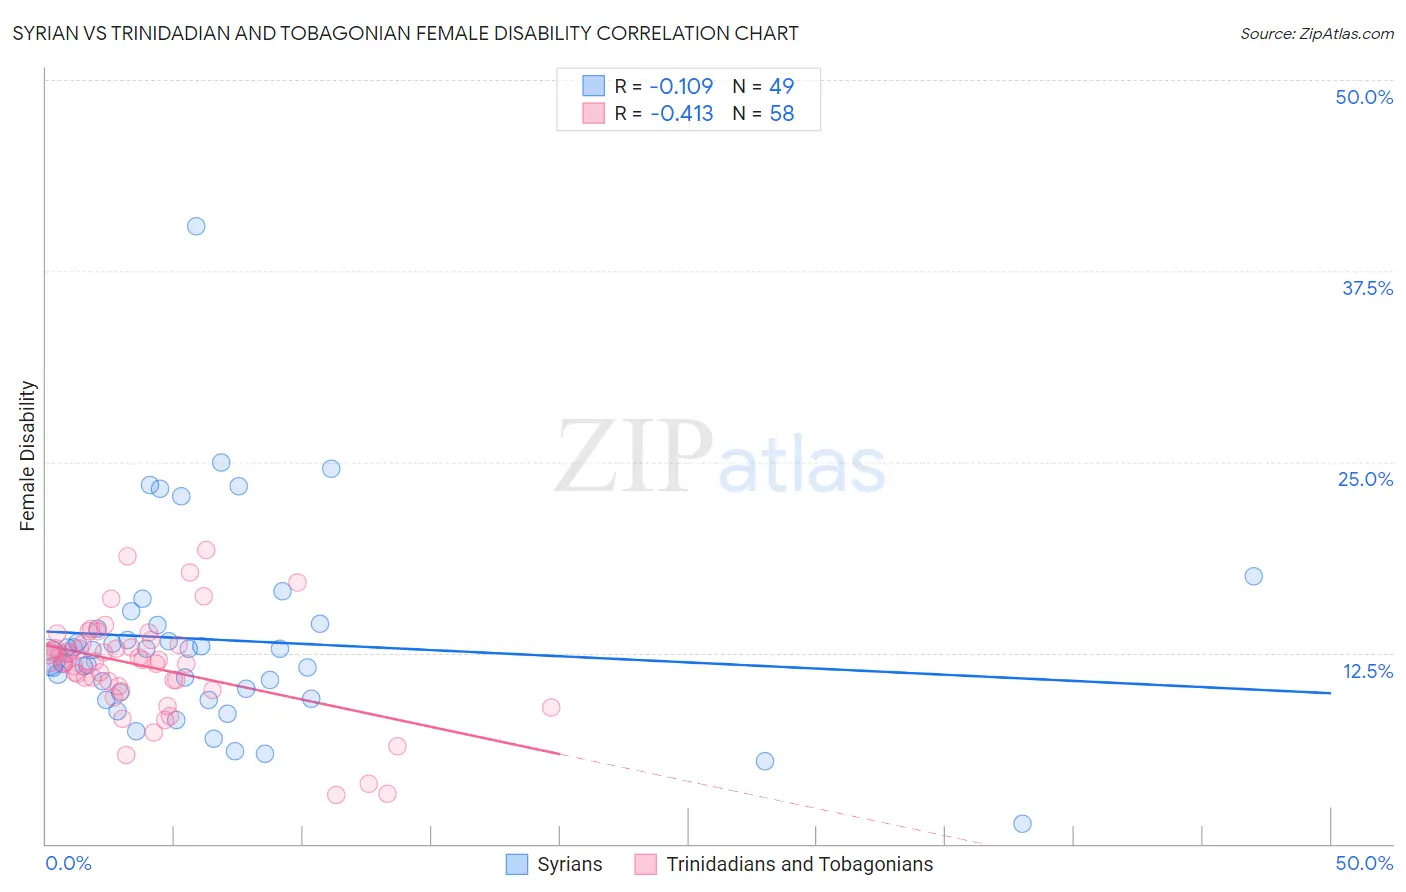
Syrian vs Trinidadian and Tobagonian Female Disability Correlation Chart
The statistical analysis conducted on geographies consisting of 266,312,876 people shows a poor negative correlation between the proportion of Syrians and percentage of females with a disability in the United States with a correlation coefficient (R) of -0.109 and weighted average of 12.1%. Similarly, the statistical analysis conducted on geographies consisting of 219,838,071 people shows a moderate negative correlation between the proportion of Trinidadians and Tobagonians and percentage of females with a disability in the United States with a correlation coefficient (R) of -0.413 and weighted average of 12.3%, a difference of 2.3%.
Female Disability Correlation Summary
| Measurement | Syrian | Trinidadian and Tobagonian |
| Minimum | 1.3% | 3.2% |
| Maximum | 40.4% | 19.2% |
| Range | 39.1% | 16.0% |
| Mean | 13.3% | 11.6% |
| Median | 12.7% | 12.0% |
| Interquartile 25% (IQ1) | 9.7% | 10.3% |
| Interquartile 75% (IQ3) | 14.4% | 13.0% |
| Interquartile Range (IQR) | 4.7% | 2.7% |
| Standard Deviation (Sample) | 6.5% | 3.3% |
| Standard Deviation (Population) | 6.4% | 3.3% |
Similar Demographics by Female Disability
Demographics Similar to Syrians by Female Disability
In terms of female disability, the demographic groups most similar to Syrians are Ghanaian (12.1%, a difference of 0.020%), Immigrants from Scotland (12.0%, a difference of 0.13%), Sudanese (12.0%, a difference of 0.13%), Moroccan (12.1%, a difference of 0.20%), and Icelander (12.0%, a difference of 0.22%).
| Demographics | Rating | Rank | Female Disability |
| Nigerians | 84.0 /100 | #147 | Excellent 12.0% |
| Immigrants | Kenya | 83.1 /100 | #148 | Excellent 12.0% |
| Greeks | 82.0 /100 | #149 | Excellent 12.0% |
| Immigrants | Moldova | 81.4 /100 | #150 | Excellent 12.0% |
| Icelanders | 80.7 /100 | #151 | Excellent 12.0% |
| Immigrants | Scotland | 79.3 /100 | #152 | Good 12.0% |
| Sudanese | 79.1 /100 | #153 | Good 12.0% |
| Syrians | 76.9 /100 | #154 | Good 12.1% |
| Ghanaians | 76.6 /100 | #155 | Good 12.1% |
| Moroccans | 72.9 /100 | #156 | Good 12.1% |
| Danes | 72.5 /100 | #157 | Good 12.1% |
| Immigrants | Middle Africa | 72.4 /100 | #158 | Good 12.1% |
| Immigrants | Central America | 67.7 /100 | #159 | Good 12.1% |
| Immigrants | Guatemala | 66.0 /100 | #160 | Good 12.1% |
| Guyanese | 64.7 /100 | #161 | Good 12.1% |
Demographics Similar to Trinidadians and Tobagonians by Female Disability
In terms of female disability, the demographic groups most similar to Trinidadians and Tobagonians are Chinese (12.3%, a difference of 0.010%), Somali (12.3%, a difference of 0.040%), Immigrants from Barbados (12.3%, a difference of 0.070%), Immigrants from Zaire (12.3%, a difference of 0.080%), and Immigrants from Grenada (12.4%, a difference of 0.10%).
| Demographics | Rating | Rank | Female Disability |
| Northern Europeans | 27.5 /100 | #193 | Fair 12.3% |
| Ukrainians | 27.2 /100 | #194 | Fair 12.3% |
| Swedes | 26.6 /100 | #195 | Fair 12.3% |
| Immigrants | Panama | 25.5 /100 | #196 | Fair 12.3% |
| Hondurans | 25.4 /100 | #197 | Fair 12.3% |
| Mexican American Indians | 24.9 /100 | #198 | Fair 12.3% |
| Immigrants | Trinidad and Tobago | 24.7 /100 | #199 | Fair 12.3% |
| Trinidadians and Tobagonians | 22.4 /100 | #200 | Fair 12.3% |
| Chinese | 22.1 /100 | #201 | Fair 12.3% |
| Somalis | 21.5 /100 | #202 | Fair 12.3% |
| Immigrants | Barbados | 21.1 /100 | #203 | Fair 12.3% |
| Immigrants | Zaire | 20.9 /100 | #204 | Fair 12.3% |
| Immigrants | Grenada | 20.5 /100 | #205 | Fair 12.4% |
| Immigrants | Cuba | 20.2 /100 | #206 | Fair 12.4% |
| Croatians | 20.2 /100 | #207 | Fair 12.4% |