Syrian vs Trinidadian and Tobagonian 4th Grade
COMPARE
Syrian
Trinidadian and Tobagonian
4th Grade
4th Grade Comparison
Syrians
Trinidadians and Tobagonians
97.8%
4TH GRADE
94.9/ 100
METRIC RATING
117th/ 347
METRIC RANK
96.9%
4TH GRADE
0.1/ 100
METRIC RATING
274th/ 347
METRIC RANK
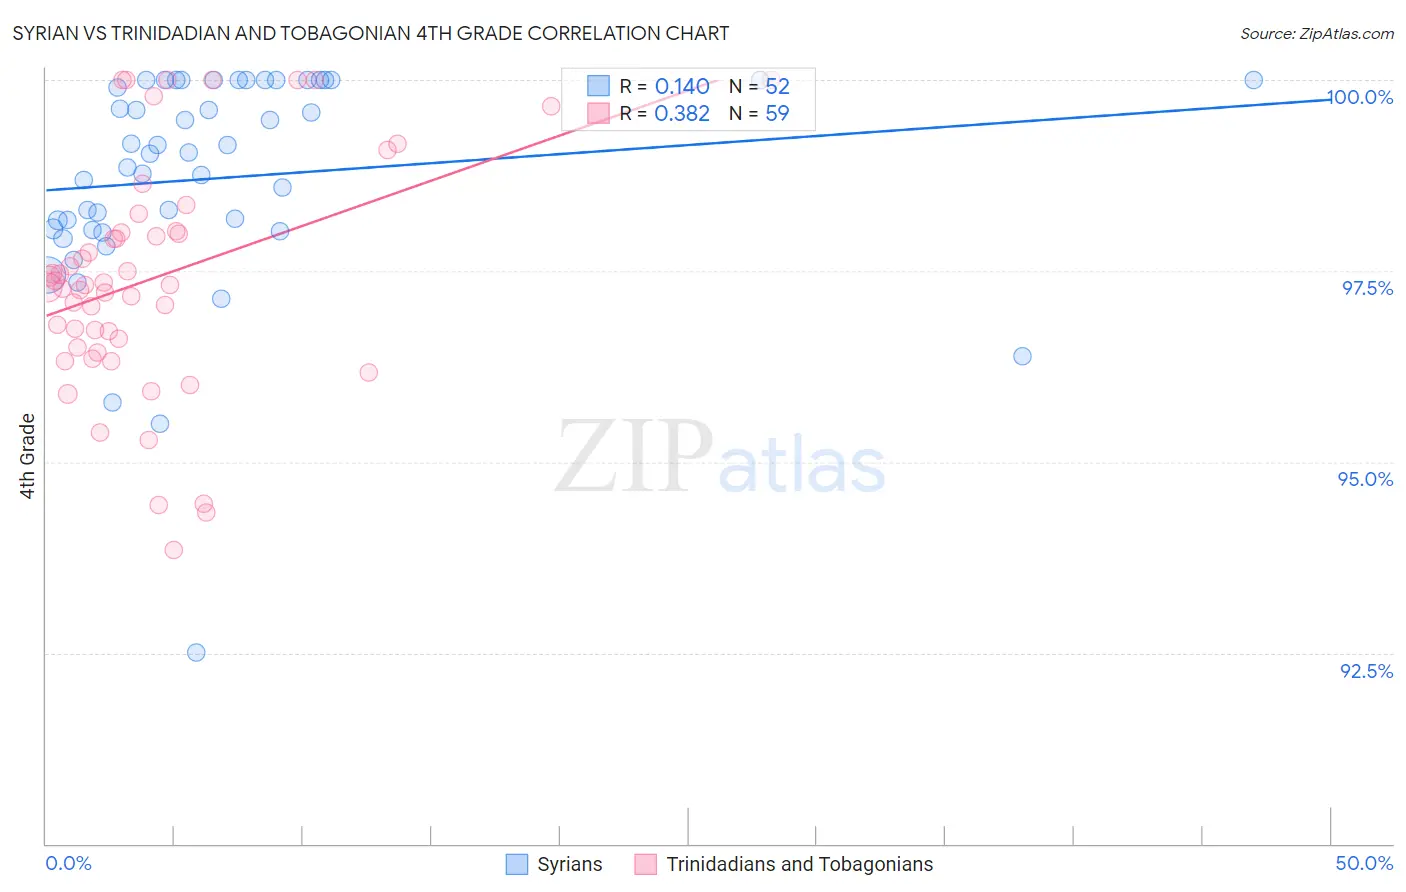
Syrian vs Trinidadian and Tobagonian 4th Grade Correlation Chart
The statistical analysis conducted on geographies consisting of 266,305,988 people shows a poor positive correlation between the proportion of Syrians and percentage of population with at least 4th grade education in the United States with a correlation coefficient (R) of 0.140 and weighted average of 97.8%. Similarly, the statistical analysis conducted on geographies consisting of 219,882,819 people shows a mild positive correlation between the proportion of Trinidadians and Tobagonians and percentage of population with at least 4th grade education in the United States with a correlation coefficient (R) of 0.382 and weighted average of 96.9%, a difference of 0.92%.
4th Grade Correlation Summary
| Measurement | Syrian | Trinidadian and Tobagonian |
| Minimum | 92.5% | 93.8% |
| Maximum | 100.0% | 100.0% |
| Range | 7.5% | 6.2% |
| Mean | 98.7% | 97.4% |
| Median | 99.0% | 97.3% |
| Interquartile 25% (IQ1) | 98.0% | 96.5% |
| Interquartile 75% (IQ3) | 100.0% | 98.0% |
| Interquartile Range (IQR) | 2.0% | 1.5% |
| Standard Deviation (Sample) | 1.4% | 1.5% |
| Standard Deviation (Population) | 1.4% | 1.5% |
Similar Demographics by 4th Grade
Demographics Similar to Syrians by 4th Grade
In terms of 4th grade, the demographic groups most similar to Syrians are Menominee (97.8%, a difference of 0.0%), Immigrants from Saudi Arabia (97.8%, a difference of 0.0%), Immigrants from France (97.8%, a difference of 0.0%), Iroquois (97.8%, a difference of 0.010%), and Lebanese (97.8%, a difference of 0.010%).
| Demographics | Rating | Rank | 4th Grade |
| Thais | 96.7 /100 | #110 | Exceptional 97.8% |
| Immigrants | Switzerland | 96.1 /100 | #111 | Exceptional 97.8% |
| Okinawans | 96.0 /100 | #112 | Exceptional 97.8% |
| Basques | 95.8 /100 | #113 | Exceptional 97.8% |
| Iroquois | 95.4 /100 | #114 | Exceptional 97.8% |
| Lebanese | 95.4 /100 | #115 | Exceptional 97.8% |
| Immigrants | Croatia | 95.2 /100 | #116 | Exceptional 97.8% |
| Syrians | 94.9 /100 | #117 | Exceptional 97.8% |
| Menominee | 94.9 /100 | #118 | Exceptional 97.8% |
| Immigrants | Saudi Arabia | 94.8 /100 | #119 | Exceptional 97.8% |
| Immigrants | France | 94.8 /100 | #120 | Exceptional 97.8% |
| Immigrants | Norway | 94.2 /100 | #121 | Exceptional 97.8% |
| Immigrants | Japan | 94.1 /100 | #122 | Exceptional 97.8% |
| Immigrants | Zimbabwe | 93.9 /100 | #123 | Exceptional 97.8% |
| Spanish | 93.7 /100 | #124 | Exceptional 97.8% |
Demographics Similar to Trinidadians and Tobagonians by 4th Grade
In terms of 4th grade, the demographic groups most similar to Trinidadians and Tobagonians are Fijian (96.9%, a difference of 0.010%), Immigrants from Cameroon (96.9%, a difference of 0.010%), Immigrants from Ghana (96.9%, a difference of 0.010%), Yaqui (96.9%, a difference of 0.010%), and Immigrants from Western Africa (96.9%, a difference of 0.010%).
| Demographics | Rating | Rank | 4th Grade |
| Immigrants | Nigeria | 0.3 /100 | #267 | Tragic 97.0% |
| Ghanaians | 0.2 /100 | #268 | Tragic 97.0% |
| Immigrants | Uzbekistan | 0.2 /100 | #269 | Tragic 96.9% |
| Cubans | 0.2 /100 | #270 | Tragic 96.9% |
| Immigrants | Peru | 0.1 /100 | #271 | Tragic 96.9% |
| Fijians | 0.1 /100 | #272 | Tragic 96.9% |
| Immigrants | Cameroon | 0.1 /100 | #273 | Tragic 96.9% |
| Trinidadians and Tobagonians | 0.1 /100 | #274 | Tragic 96.9% |
| Immigrants | Ghana | 0.1 /100 | #275 | Tragic 96.9% |
| Yaqui | 0.1 /100 | #276 | Tragic 96.9% |
| Immigrants | Western Africa | 0.1 /100 | #277 | Tragic 96.9% |
| Immigrants | Bolivia | 0.1 /100 | #278 | Tragic 96.9% |
| Afghans | 0.1 /100 | #279 | Tragic 96.9% |
| Barbadians | 0.1 /100 | #280 | Tragic 96.9% |
| Immigrants | Hong Kong | 0.1 /100 | #281 | Tragic 96.9% |